
Forecast VCF Capacity Growth in VCF Operations
Which four steps should the administrator perform within VCF Operations to determine whether there is sufficient capacity within the cluster to complete all planned migration phases? (Choose four.)
A. Create a single What-If Analysis scenario that represents all migration phases together
B. Persist each scenario configuration without performing analysis
C. Add virtual machine workloads to each What-If Analysis scenario for the corresponding migration phase
D. Import Application Profiles from the source vCenter environment
E. Run all What-If Analysis scenarios together to evaluate the combined impact on the target cluster
F. Create a separate What-If Analysis scenario for each migration phase
G. Configure an Application Profile in each scenario to represent the VM t-shirt sizing
H. Use migration execution planning workflows to assess cluster capacity
Explanations:
Here is the breakdown of the correct steps and why the others are incorrect for determining cluster capacity using VCF Operations (formerly vRealize Operations):
F. Create a separate What-If Analysis scenario for each migration phase.
Migration projects are typically complex and divided into logical phases or "waves" based on dependencies and priority. Creating separate scenarios for each phase allows the administrator to model the incremental impact of each stage on the target cluster's resources (CPU, RAM, Storage). This avoids the "big bang" approach, which can hide intermediate resource constraints .
C. Add virtual machine workloads to each What-If Analysis scenario for the corresponding migration phase.
A scenario is only useful if it contains specific workloads. VCF Operations allows you to define the workload by either manually configuring T-shirt sizes (vCPU, Memory) or importing existing VMs from the source vCenter environment. Adding the specific VMs for Phase 1 to Scenario 1, and Phase 2 to Scenario 2, ensures the capacity calculation reflects the actual resource consumption of the migration .
G. Configure an Application Profile in each scenario to represent the VM t-shirt sizing.
An "Application Profile" is the container within the scenario that holds the specification of the workload (vCPU, Memory, Disk). By configuring this profile (either by manual entry or by importing from an existing VM), you define the "size" or T-shirt size of the workloads moving in that phase .
E. Run all What-If Analysis scenarios together to evaluate the combined impact on the target cluster.
After creating individual scenarios for Phase 1, Phase 2, and Phase 3, the administrator should select them in the What-If Analysis interface and run them cumulatively. The official VCF 9.0 documentation explicitly states: "You can select more than one compatible scenario and run them together...to see the capacity after..." . This provides the total combined stress on the target cluster.
❌ Why the other options are wrong
A. Create a single What-If Analysis scenario...
Why it is wrong: A single scenario models a single event. While you could lump all VMs into one scenario, it prevents you from modeling the intermediate state of the cluster (e.g., after Phase 1 but before Phase 2) to ensure you don't run out of capacity halfway through the migration window .
B. Persist each scenario configuration without performing analysis.
Why it is wrong: Saving without analyzing performs no calculation. The goal is to determine "sufficient capacity," which requires running the analysis to view the "Remaining Time" and "Capacity Remaining" metrics .
D. Import Application Profiles from the source vCenter environment.
Why it is wrong: This is a distractor. You do not import a generic "Application Profile" from vCenter. In the UI, you Import VMs to use as templates to build the Application Profile, or you configure the profile manually. You import VMs, not profiles .
H. Use migration execution planning workflows.
Why it is wrong: "Migration execution planning workflows" (likely referring to HCX migration waves or planning) are used to execute the migration, not to perform capacity analysis calculations. The question specifically asks what to do within VCF Operations to determine capacity .
📚 Reference
Combined Scenarios: VCF Operations specifically allows the selection of multiple saved scenarios (e.g., Phase 1 and Phase 2) to be run together to evaluate cumulative impact .
Workload Definition: Capacity planning requires defining the workload via Application Profiles built from Configuring specs or Importing from existing VM
An administrator is assigned the task of configuring a custom dashboard within VMware Cloud Foundation Operations to monitor CPU, memory, and disk usage metrics across all VMs in a specific workload domain, with the ability to extract detailed usage data in CSV format. Which view type should the administrator use?
A. List View
B. Scoreboard View
C. Object Relationship View
D. Trend View
Explanation:
The List View is the appropriate choice in VCF (VMware Cloud Foundation) Operations when you need to monitor and export specific metric data across multiple objects. Here is how it fulfills each requirement:
Requirement: Monitor CPU, Memory, and Disk usage metrics across all VMs in a specific workload domain.
The List View is specifically designed to display tabular data about specific objects in the monitored environment . You can configure it to show exactly the metrics you need (CPU, Memory, Disk) for all Virtual Machines (VMs) that belong to a specific group or workload domain . Unlike visual-heavy views, the List View focuses on raw data in rows and columns, which is ideal for checking performance metrics across many VMs.
Requirement: Extract detailed usage data in CSV format.
The official documentation for VCF 9.0 and VMware Aria Operations explicitly states that you can export the view as a CSV file for any view type . However, in the context of this requirement (listing 50+ VMs with specific metrics), the List View is the standard operational practice. The export option in the toolbar works seamlessly with List Views to generate the required CSV report .
Why the other options are incorrect
B. Scoreboard View:
This view type is generally used for high-level, at-a-glance status summaries (often represented by gauges or health icons). It does not provide the detailed metric table view required for export or detailed analysis of individual VMs.
C. Object Relationship View:
This view is used to visualize the relationships and dependencies between objects (e.g., which VMs are on which hosts). It is a topological or graphical view, not a data-grid view, and it does not support the CSV export requirement in the same tabular context as the List View .
D. Trend View:
While Trend Views are excellent for displaying historical data and forecasting future usage, they are primarily used for line charts and time-series analysis . You generally cannot export a list of specific VMs and their current/individual metric values directly from a standard Trend View configuration in the same way you can from a List View . The requirement explicitly asks for monitoring "across all VMs" (implying a current snapshot or recent data points in a list), not necessarily a long-term trend line.
Reference:
List View Export: The toolbar for the View widget includes an "Export as CSV" option applicable to all views, but the List View is the standard tool for exporting lists of object properties .
Configuration: List Views can be configured to target specific object types (like VMs in a workload domain) and display specific metrics (CPU, Memory, Disk) .
An administrator is responsible for a VCF Private Cloud that is isolated from the Internet. Which four steps must an administrator complete to remain fully licensed whilst operating in a Disconnected Reporting Mode before the Next Usage Report is due? (Choose four.)
A. Add the license key into VCF Operations while connected to the Internet
B. Upload the file to the VCF Business Services Console
C. Enable SSH on all ESX hosts
D. Generate a Usage file from within VCF Operations
E. Download the license key from the Broadcom Support Portal
F. Import the license file into VCF Operations
G. Download the license file from the VCF Business Services Console
Explanations:
D. Generate a Usage file from within VCF Operations.
The first step in the disconnected reporting cycle is to generate a usage file from your VCF Operations instance. This file contains the consumption data for your subscribed products. You navigate to Administration > Licensing > Registration and click Generate Usage File.
G. Download the license file from the VCF Business Services Console.
After uploading the usage file to the Broadcom VCF Business Services Console (VCF BSC), the system processes the data and generates a new license file. You must download this .lic file from the VCF BSC portal to your local machine to import it into your isolated environment.
E. Upload the file to the VCF Business Services Console.
Once you have generated the usage file (Step D), you must transfer it (via secure methods like USB or SCP) to a machine with internet access. You then log in to the VCF Business Services Console, locate your VCF Operations registration, and click Upload Usage File to submit the usage data.
F. Import the license file into VCF Operations.
Explanation: After you download the new license file from the VCF BSC (Step G), you transfer it back to the isolated environment. In the VCF Operations UI, you navigate to Administration > Licensing > Registration and click Import License File to apply the updated licenses to your environment.
❌ Why the other options are incorrect
A. Add the license key into VCF Operations while connected to the Internet.
Why it is wrong: This describes "Connected Mode." The scenario explicitly states the environment is isolated from the Internet (Disconnected Mode), meaning you cannot connect directly to Broadcom to add keys automatically.
B. Enable SSH on all ESX hosts.
Why it is wrong: Enabling SSH is a troubleshooting or manual configuration tool. It is not part of the official VMware licensing workflow for VCF 9.x. License management is performed entirely through the VCF Operations UI and the VCF Business Services Console.
C. Download the license key from the Broadcom Support Portal.
Why it is wrong: VCF 9.0 does not use traditional license keys. It uses a "keyless entitlement" model where licensing is managed via files exchanged between VCF Operations and the VCF Business Services Console. You do not manually download a product key from the support portal to type in.
📚 Reference:
Disconnected Mode Workflow: The official documentation outlines the 4-step cycle for disconnected environments: Generate Usage File (VCF Ops) -> Upload Usage File (VCF BSC) -> Download License File (VCF BSC) -> Import License File (VCF Ops).
Frequency: This process must be completed at least once every 180 days to remain compliant. If the usage report is not submitted, licenses are treated as expired, and hosts are disconnected from vCenter.
Match each VCF Operations monitoring feature with its capability by dragging and dropping the correct item
from the Feature list on the left and placing it onto the Capability list on the right.


Explanation:
1. Application Discovery → Identifies services running on VMs and builds relationships between services from different VMs.
Why: "Application Discovery" in VCF Operations is specifically responsible for understanding inter-VM and inter-service dependencies. It maps out which services (e.g., a web server VM talking to a database VM) are connected, creating an application topology.
2. Product-Managed Telegraf → Monitors supported operating systems on physical servers and VMs.
Why: "Product-Managed Telegraf" refers to the Telegraf agent that is automatically deployed, configured, and updated by VCF Operations / Aria Operations. It is designed to monitor OS-level metrics (CPU, memory, disk, network) on supported guest OSes (Windows, Linux) running on both VMs and physical servers.
3. Open Source Telegraf → Monitors supported and unsupported application services as well as operating systems.
Why: The open-source version of Telegraf gives the administrator full flexibility. While product-managed Telegraf covers standard OS metrics, the open-source Telegraf agent can be manually configured with custom plugins to monitor third-party or unsupported applications (e.g., a specific legacy app, custom middleware) that the product-managed agent does not natively support.
4. Service Discovery → Identifies predefined and custom applications running on VMs when services are connected to each other.
Why: "Service Discovery" focuses on identifying application components (predefined like Apache, MySQL, or custom) running within a VM. Once Service Discovery identifies these services and sees they are connected (e.g., ports open between VMs), it can also assist in understanding the application stack. Note that Service Discovery is often related to Application Discovery, but the given capability explicitly mentions "identifies...applications running on VMs when services are connected," which matches Service Discovery's role in detecting the application components themselves.
Reference:
Application Discovery: Mapping relationships between services across different VMs (application dependency mapping).
Product-Managed Telegraf: Automated OS and hardware monitoring for supported operating systems.
An administrator has been tasked with configuring a VCF Operations policy to enable a more conservative capacity modelling. When setting the Risk Level Configuration, what is the time remaining metric based on?
A. Actual Projection of Available Capacity Mean
B. Actual Projection of Capacity Utilization Mean
C. Lower Bounds Projection of Capacity Utilization
D. Upper Bounds Projection of Capacity Utilization
Explanation:
When you configure a Conservative risk level in VCF Operations (formerly VMware Aria Operations), the capacity engine calculates the "Time Remaining" metric—the number of days until projected utilization crosses the usable capacity threshold—using the upper bound projection of capacity utilization .
The capacity engine analyzes historical utilization data and projects a future workload range that includes both an upper bound projection and a lower bound projection . The upper bound represents the high-end estimate based on historical utilization peaks. For Conservative risk levels (designed for production and mission-critical workloads), the engine explicitly uses this upper bound projection to provide a cautious forecast that helps prevent unexpected capacity exhaustion . As documented, "The engine considers the upper bound projection for a conservative risk level" .
Conversely, for Aggressive risk levels (used for non-critical workloads), the engine uses the mean (average) of the upper and lower bound projections .
Why Other Options Are Incorrect
A (Actual Projection of Available Capacity Mean) & B (Actual Projection of Capacity Utilization Mean)
– The mean projection is specifically used for Aggressive risk levels, not Conservative . Selecting the mean would underestimate future demand and risk capacity shortages.
C (Lower Bounds Projection of Capacity Utilization)
– This represents the most optimistic forecast, ignoring historical utilization peaks. Using it would dangerously underestimate future resource consumption, contradicting the purpose of a conservative policy .
Reference:
Broadcom TechDocs: How Does VCF Operations Calculate and Forecast Capacity (VCF 9.0) ; Capacity Details
An administrator is migrating VMs from an unmanaged vCenter into a VCF workload domain over 12 months and must ensure the reserved migration capacity is not consumed by other projects. Which action ensures that the migration capacity is considered when future projects are modeled?
A. Create a Committed Scenario for the migration project
B. Create a single scenario containing the VMs for the migration project and the future project
C. Use the Migration Planning: VMware Cloud option when creating the scenarios for the migration project
D. Create a new scenario for each future project with a start date twelve months later
Explanation:
When an administrator reserves migration capacity for a 12-month project and needs to ensure other projects do not consume that capacity, a Committed Scenario is the appropriate mechanism in VCF Operations. A committed scenario reserves capacity for planned workloads within the capacity engine, preventing other projects from being modeled against the same reserved resources . This feature is specifically designed for organizations with separate capacity management and operations teams—it ensures that once capacity is reserved for a migration project, subsequent capacity planning for other projects cannot utilize those resources, as VCF Operations effectively "sets aside" that capacity .
By creating a committed scenario for the migration project, the administrator ensures that when future projects are modeled using What-If Analysis, the reserved migration capacity is automatically factored into capacity calculations, preventing overallocation.
Why Other Options Are Incorrect
B. Create a single scenario containing the VMs for both projects
– A standard (non-committed) scenario does not reserve capacity. It only models a hypothetical workload without persisting that reservation for future calculations. Other projects would not be aware of the migration's capacity consumption .
C. Use Migration Planning: VMware Cloud option
– This feature is for comparing capacity and cost across different VMware Cloud environments (e.g., VMware Cloud on AWS, AVS) . The scenario involves migrating from an unmanaged vCenter into an existing VCF workload domain, not to a different cloud provider.
D. Create a new scenario for each future project with a start date
– This does nothing to reserve the migration capacity. Each new scenario would need to manually account for the migration workload, and without a committed scenario, there is no automatic mechanism preventing double-booking of capacity.
Reference
Broadcom TechDocs: What-If Analysis: Modeling Workload, Capacity, or Migration Planning – "When you are sure that you need to reserve capacity, you can commit the scenario to have VCF Operations set aside resources for new, upcoming, or planned workloads"
Arrange the following steps in the correct order to schedule the delivery of a weekly report created in VCF
Operations.
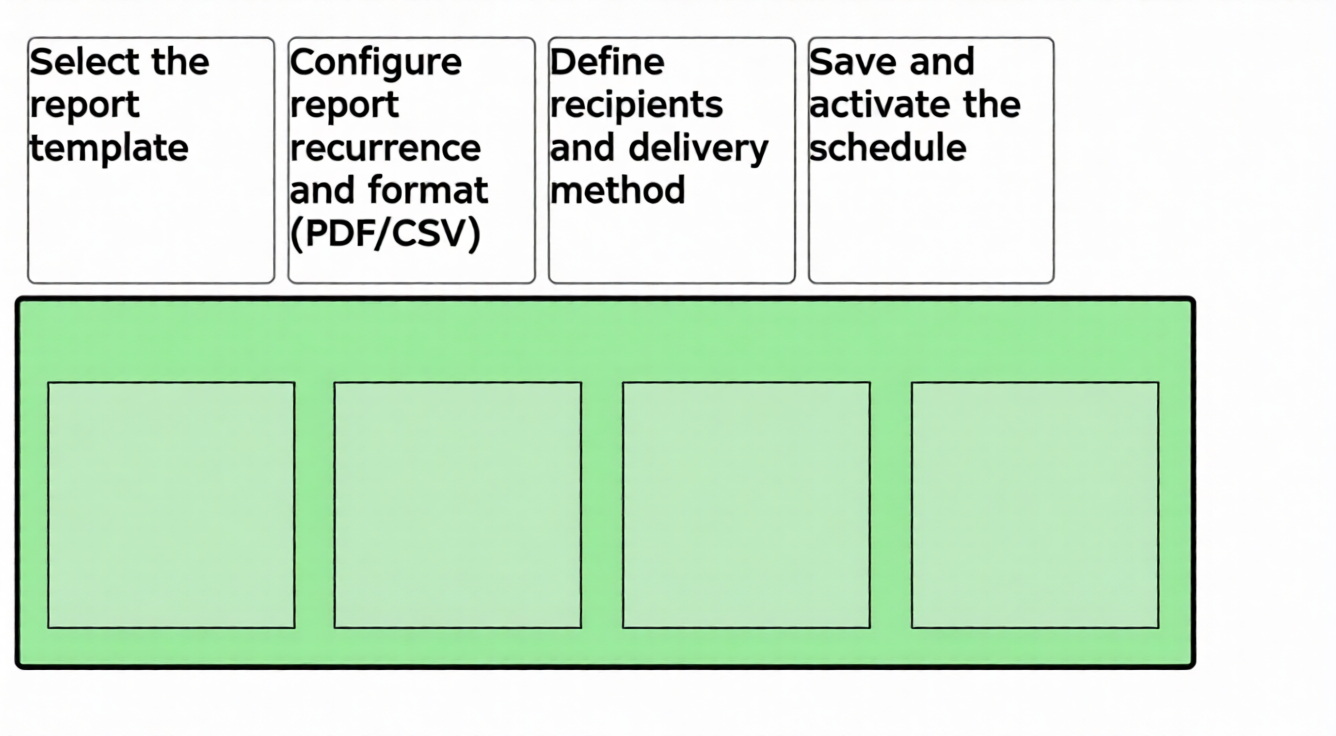
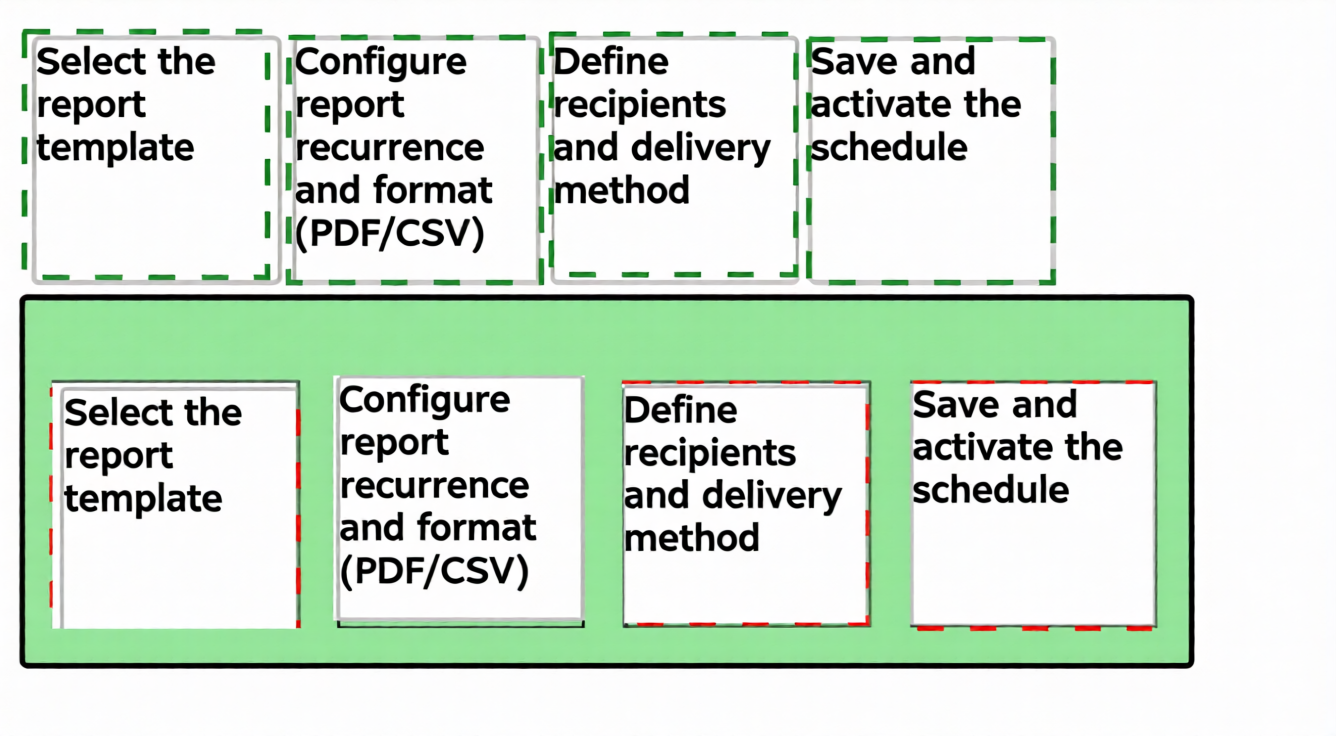
Explanation:
When automating reporting in VCF Operations, the workflow strictly follows a logical progressive wizard:
Step 1: Select the report template Before configuring schedules or delivery mechanisms, you must target the specific data template. You browse your repository of custom or out-of-the-box templates (e.g., Cluster Capacity, Workload Optimization, or Compliance reports) to choose what content will be generated.
Step 2: Configure report recurrence and format (PDF/CSV) Once the template is selected, you must specify how often the report runs and how it should look. This is where you select the weekly frequency (e.g., every Monday at 8:00 AM) and determine the output layout (PDF for human reading, or CSV for data parsing/external spreadsheets).
Step 3: Define recipients and delivery method With the report formatted and timed, the system needs to know where to send it. In this step, you configure the delivery outbound plugin—most commonly Email (via SMTP)—and populate the destination email addresses or distribution lists.
Step 4: Save and activate the schedule The final step commits the configuration to the VCF Operations database. Saving commits the parameters, and activating ensures the internal cron-like scheduling service begins tracking the weekly window to execute the job moving forward.
References
VMware Cloud Foundation Operations Guide / VMware Aria Operations User Guide: Managing and Configuring Reports -> Scheduling Report Generation and Email Delivery.
An administrator was asked to prepare a report that groups VMs into buckets by CPU Ready % such as 0–2%, 2–5%, 5–10%, and > 10% to visualize the spread. Which view should be used to provide such visualization?
A. List View
B. Trend View
C. Distribution View
D. Summary View
Explanation:
A Distribution View is the appropriate choice for grouping data into configurable buckets or ranges. The official documentation confirms that VCF Operations (formerly VMware Aria Operations) uses bar charts to place each VM into specific performance buckets based on a given metric—such as CPU Ready %—and then color-codes them based on best practice thresholds . This type of view allows you to see how many VMs fall into each range (e.g., 0–2%, 2–5%, 5–10%, >10%) at a glance, which is exactly the "spread" visualization the report requires.
Why Other Options Are Incorrect
A (List View)
– Displays data in a table format showing individual VMs and their metrics, but does not automatically group them into percentage buckets or provide a visual distribution .
B (Trend View)
– Shows metric values over time using line charts. While useful for analyzing how CPU Ready % changes for a single VM, it is not designed for grouping multiple VMs into buckets .
D (Summary View)
– Provides high-level aggregated information, such as total capacity or overall health status. It does not offer the granular bucketing required to visualize a metric spread across many objects.
Reference
Broadcom TechDocs: VM Contention Dashboard – "For each VM, it picks the worst metric in the last 24 hours...the bar charts puts each VM in the respective performance buckets" . Broadcom TechDocs: Using the Capacity Page – Describes trend visualization for time-series data .
An administrator wants to graphically represent which ESX hosts have the highest memory ballooning activity. Which custom view in VCF Operations would satisfy this requirement?
A. List view with Host Systems and memory ballooning usage metrics
B. Trend view with Host System objects and memory ballooning usage metrics
C. Summary view with cluster-level memory ballooning average metrics
D. Distribution view with Host Systems and memory ballooning usage metrics
Explanation
To graphically represent which ESXi hosts have the highest memory ballooning activity, you need a view that can show multiple hosts and their associated ballooning metrics in a ranked, comparative format.
A List View is specifically designed to display tabular data about specific objects in the monitored environment . When configured with Host System objects and the memory ballooning usage metric (mem|vmmemctl_average), it can list all ESXi hosts, display their current or historical ballooning values, and sort the list to show which host has the highest activity at the top. The official VCF Operations documentation explains that when you select an ESXi host from such a list, all detailed utilization charts—including balloon memory metrics—are displayed for that selected host . This provides both the "graphical representation" (through charts) and the comparative ranking (through the sorted list) that the requirement asks for.
Why Other Options Are Incorrect
B. Trend view with Host System objects and memory ballooning usage metrics:
A Trend view shows how a single metric changes over time using a line chart. It is suitable for examining ballooning patterns for one host, but it cannot graphically compare which host has the highest ballooning activity across multiple hosts simultaneously .
C. Summary view with cluster-level memory ballooning average metrics:
This view aggregates data at the cluster level, hiding individual host performance. The requirement specifically asks for identifying which ESX hosts have the highest activity, not the average behavior of an entire cluster.
D. Distribution view with Host Systems and memory ballooning usage metrics:
A Distribution view groups metric values into predefined buckets or ranges (e.g., 0-100 MB, 100-500 MB, 500+ MB) to show the spread of a metric across objects. While useful for visualizing how many hosts fall into each activity range, it does not allow you to pinpoint exactly which single host is highest or rank them in order .
Reference
Broadcom TechDocs: ESXi Utilization Dashboard – "It lists all the ESXi hosts, sorted by the highest utilization...All the utilization charts display the key utilization metrics of the selected cluster. For memory, the high utilization counters are explicitly shown, for example balloon"
Broadcom TechDocs:Resource Pool Metrics – Provides the metric key for memory ballooning (mem|vmmemctl_average)
An administrator has been tasked with customizing the “Live! Heavy Hitters” Dashboard to include the metric “Cost | VM Cost Trend.” What action should the administrator take to complete this task?
A. Within the Manage Dashboards panel, click “Change Ownership” to assign edit permission and add the relevant metric
B. Within the Dashboards Overview panel, click the “Live! Heavy Hitters” Dashboard, click the Edit action and add the relevant metric
C. Within the Manage Dashboards panel, click the checkbox for the dashboard, click Edit and add the relevant metric
D. Within the Manage Dashboards panel, Export the dashboard and add the relevant metric
E. Within the Manage Dashboards panel, Clone the dashboard and add the relevant metric
Explanation:
To edit an existing dashboard such as "Live! Heavy Hitters" and add a new metric ("Cost | VM Cost Trend"), the administrator must navigate to the Manage Dashboards panel, select the dashboard by checking the checkbox, and then click the Edit action from the vertical ellipsis menu . Once in edit mode, you can add the metric by modifying the relevant widget (e.g., a View or Metric Chart widget) that displays cost data .
This matches the standard workflow documented for VCF Operations: from the left menu, click Dashboards, then the Manage tab, select the desired dashboard, click the vertical ellipsis, and choose Edit .
Why Other Options Are Incorrect
A. Change Ownership
– This action reassigns dashboard ownership to another user but does not allow editing of dashboard content or metrics . It has no effect on the metrics displayed.
B. Click the "Live! Heavy Hitters" Dashboard, click the Edit action
– While this describes the correct intent, the workflow is incomplete. The Edit action is accessed from the Manage Dashboards panel, not directly from the Dashboard Overview panel when viewing the dashboard .
D. Export the dashboard
– Exporting creates a JSON file for backup or migration purposes . It does not allow editing of the dashboard content.
E. Clone the dashboard
– Cloning creates a duplicate dashboard with a new name, preserving the original . While you could edit the cloned version, this creates an unnecessary duplicate rather than modifying the existing "Live! Heavy Hitters" dashboard. The question implies modifying the existing dashboard, not creating a copy.
Reference
Broadcom TechDocs:Manage Dashboards – "You can select a dashboard from the list, click the vertical ellipsis against each dashboard, and select the various options such as edit, delete, clone, and deactivate a dashboard" .
Broadcom TechDocs: Dashboards in VCF Operations – "You can clone and edit the predefined dashboards or start from scratch"
An administrator has just deployed a VMware Cloud Foundation Private Cloud and now must ensure it is correctly licensed. The administrator has registered the VCF deployment with the VCF Business Services console and has downloaded the necessary license file and keys. Which three products would be licensed using a license file? (Choose three.)
A. VMware Private AI Foundation with NVIDIA
B. VMware HCX Enterprise
C. VMware Data Services Manager
D. VMware vDefend
E. vSAN Add-on Capacity
F. VMware Tanzu Platform
✅ Explanation:
In VCF 9.0, license keys are no longer used. Licensing is managed through license files in the VCF Business Services Console, with two distinct types of licenses:
Primary License (e.g., VMware Cloud Foundation - cores) – Automatically licenses components like NSX, HCX, and Tanzu when assigned to a vCenter instance.
Add-on Licenses – Required for additional capacity beyond the base subscription.
A. VMware Private AI Foundation with NVIDIA
– Explicitly listed as a supported add-on license in VCF 9.0. It requires manual assignment to the management domain to activate the guided deployment UI.
B. VMware HCX Enterprise
– While HCX is included with the primary VCF license, the question references licensing using a license file. Pre-version 9 license keys included HCX Enterprise; however, in VCF 9.0, HCX functionality is entitled under the primary VMware Cloud Foundation (cores) license file. It does not require a separate add-on license file.
E. vSAN Add-on Capacity
– The official documentation states: "The two supported add-on licenses using the new licensing system are VMware vSAN (TiB) and VMware Private AI Foundation with NVIDIA (cores)". This is required when storage needs exceed the base vSAN entitlement (1 TiB per licensed core).
❌ Why Other Options Are Incorrect
C. VMware Data Services Manager (DSM)
– DSM is a DBaaS add-on to VCF but is licensed automatically under the primary VCF license when assigned to a vCenter instance. It does not require a separate add-on license file.
D. VMware vDefend
– In VCF 9.0, individual security components like vDefend are no longer licensed separately. They are automatically licensed when the primary VMware Cloud Foundation license is assigned to a vCenter instance.
F. VMware Tanzu Platform
– Tanzu capabilities (including Tanzu Kubernetes Grid) are included as product components of the primary VCF subscription. No separate license file is required.
📚 Reference
Broadcom TechDocs: Licensing Overview for VCF 9.0 – "The two supported add-on licenses...VMware vSAN (TiB) and VMware Private AI Foundation with NVIDIA (cores)".
Broadcom TechDocs: 9.0 Product Subscription and Licensing – Lists HCX Enterprise as a component licensed under the primary VCF (cores) license.
An administrator has set up managed Telegraf agents through the VMware Cloud Foundation Private Cloud
to monitor applications. Data has been collecting properly for the last three months, but gaps in the collection
have been noticed during Collector Group maintenance. The application teams have asked to reduce these
gaps going forward, so the administrator has decided to activate Application Groups High Availability on the
Collector Groups.
Drag and drop the three correct items the administrator must consider from the Options list on the left and
place them into the Considerations list on the right in any order. (Choose three.)
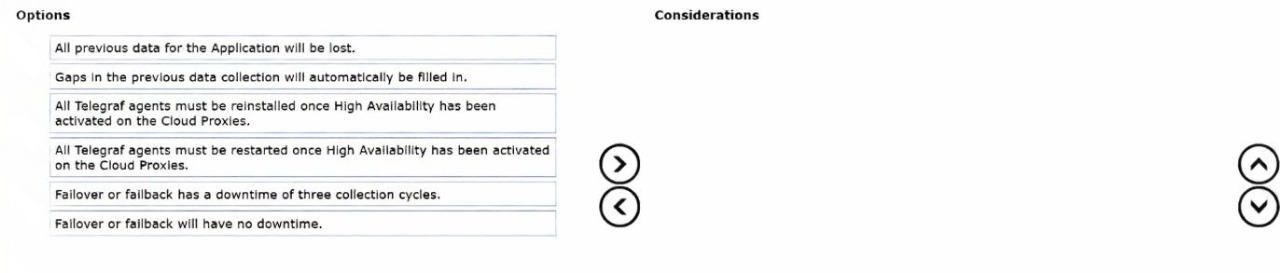
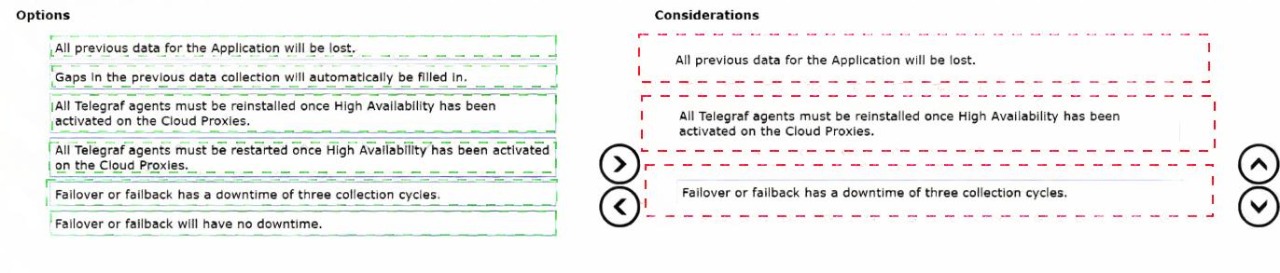
Explanation:
When activating High Availability (HA) for application monitoring utilizing managed Telegraf agents via Cloud Proxies in VCF Operations, the underlying architecture undergoes a major structural change. Here is why these considerations are critical:
All previous data for the Application will be lost:Enabling High Availability on an existing Collector Group resetting the application monitoring framework can cause existing historical metric assignments to become disconnected or erased for those specific agent configurations. This means that a backup or data export should be considered if the past 3 months of data are crucial.
All Telegraf agents must be reinstalled once High Availability has been activated on the Cloud Proxies: When HA is turned on, the configuration maps to an entire Collector Group (consisting of multiple Cloud Proxies working in an active-passive or balanced setup) rather than an individual Cloud Proxy endpoint. Because the endpoint certificate and configuration mapping change, any existing Telegraf agents must be cleanly reinstalled so they register against the HA-enabled group entity. Simply restarting the agents will fail to establish the correct multi-proxy failover endpoints.
Failover or failback has a downtime of three collection cycles: High Availability for application monitoring is not completely instantaneous. When a primary Cloud Proxy goes down, the system takes up to three collection cycles to definitively detect the heartbeat loss, declare a failure, and fully redirect the Telegraf agent metrics incoming pipeline to the secondary node.
Why the other options are incorrect:
Gaps in previous data collection will automatically be filled in: Historical collection gaps caused by previous single-point maintenance cannot retroactively be repaired or populated.
All Telegraf agents must be restarted...: As noted above, a simple service restart is insufficient because the agent needs the brand-new deployment configuration package linked to the HA group.
Failover or failback will have no downtime: This is false due to the built-in 3-cycle detection mechanism required to prevent flip-flopping or split-brain behaviors.
References
VMware Aria Operations / VCF Operations Documentation:Configuring Application Monitoring -> High Availability for Application Monitoring Cloud Proxies.
VMware KB / Architecture Guide: Explains the requirement of re-registering/re-deploying Telegraf agents when changing the deployment state of the target Cloud Proxies to an HA Collector Group configuration.
| Page 1 out of 5 Pages |
| 12 |
Real-World Scenario Mastery: Our 3V0-22.25 practice exam don't just test definitions. They present you with the same complex, scenario-based problems you'll encounter on the actual exam.
Strategic Weakness Identification: Each practice session reveals exactly where you stand. Discover which domains need more attention, before Advanced VMware Cloud Foundation 9.0 Operations exam day arrives.
Confidence Through Familiarity: There's no substitute for knowing what to expect. When you've worked through our comprehensive 3V0-22.25 practice exam questions pool covering all topics, the real exam feels like just another practice session.
Copyright © All Rights Reserved