
Topic 2: Questions Set 2
When would transaction be used instead of stats
A. To group events based on a single field value.
B. To see results of a calculation
C. To have a faster and more efficient search
D. To group events based on start/end values
Explanation:
The transaction command is specifically designed to group events that share a common characteristic across a time-ordered sequence, particularly when events have a clear start and end boundary. For example, grouping all events related to a single web session from login (start) to logout (end), or grouping database transactions that begin with a "start" event and end with a "commit" or "rollback" event. The transaction command evaluates time-based constraints such as maxpause, maxspan, and startswith/endswith to connect related events. In contrast, stats simply aggregates based on field values without any concept of event sequencing or start/end boundaries.
Why Other Options Are Incorrect
A. To group events based on a single field value – This is exactly what stats does efficiently using by clause. The transaction command is overkill and significantly slower for simple field-based grouping.
B. To see results of a calculation – The stats command (with functions like sum, avg, eval) is the correct tool for calculations. transaction does not perform calculations; it groups events.
C. To have a faster and more efficient search – transaction is known to be resource-intensive and slow, especially on large datasets. stats is almost always faster and more efficient for grouping by field values. Using transaction for speed is incorrect.
References
Splunk Documentation: "Transaction command vs stats command" – states that transaction is used for grouping related events with start/end boundaries, while stats is preferred for simple aggregations. Splunk Best Practices guide recommends avoiding transaction for large data volumes and using stats with eval when possible.
How is an event type created from the search window? (select all that apply)
A. In the top right corner, click Save As > Event Type.
B. In an event's detail dropdown, click Event Actions > Build Event Type.
C. Edit eventtypes.conf and add a new stanza.
D. Add | eventtype to the SPL and execute the search.
Explanation:
A. In the top right corner, click Save As > Event Type
✅ This is the standard GUI method from the Search & Reporting app. After running a search, you can save the search conditions (not the raw results) as an event type via Save As > Event Type.
B. In an event's detail dropdown, click Event Actions > Build Event Type
✅ From an individual event’s dropdown menu (the arrow on the left or the event actions menu), you can select Event Actions > Build Event Type, which pre-fills the search string based on that event’s fields.
C. Edit eventtypes.conf and add a new stanza
❌ This creates an event type, but not from the search window. It’s a valid backend method but does not meet the question’s constraint “from the search window.”
D. Add | eventtype to the SPL and execute the search
❌ There is no such SPL command eventtype. Event types are saved search definitions, not created via a search command.
Reference:
Splunk Documentation:
"Create event types" → Two primary methods in Splunk Web:
From the Search bar: Save As > Event Type
From an event’s dropdown: Event Actions > Build Event Type
Splunk Docs: Create event types
Which method in the Field Extractor would extract the port number from the following
event? |
10/20/2022 - 125.24.20.1 ++++ port 54 - user: admin
A. Delimiter
B. rex command
C. The Field Extractor tool cannot extract regular expressions
D. Regular expression
Explanation:
The Splunk Field Extractor (FX) UI tool offers two primary methods for extracting fields visually: Regular Expression and Delimiters.
Why D is correct: The example event features an irregular, unstructured format with a mix of spaces and plus signs (++++). To pull out the value 54 following the word port, the Field Extractor uses a regular expression (regex) capture group, generating a backend string like port\s(?
Why A is incorrect: The Delimiter method only works if your data uses a consistent, repeating separator character throughout the entire event (such as commas in a CSV file, tabs, or pipes) to split the line into predictable columns.
Why B is incorrect: The rex command is a manual SPL search command. While it uses regular expressions, it is typed directly into the search bar, not selected as a "method" inside the GUI Field Extractor utility.
Why C is incorrect: This statement is completely false; the Field Extractor's primary, default underlying technology is based on generating regular expressions automatically from your text selections.
Reference:
Splunk Documentation: Knowledge Manager Manual -> Use the Field Extractor page.
Guidelines: Select Regular Expression for unstructured logs (like system syslog files or web server logs) and Delimiters for structured text files like CSVs.
This is what Splunk uses to categorize the data that is being indexed
A. Host
B. Sourcetype
C. Index
D. Source
Explanation:
Splunk uses sourcetype to categorize data during indexing. It determines how data is broken into events (line merging, timestamps) and which default fields are applied. Common examples include access_combined (web logs) and linux_secure (auth logs).
Why the other options are incorrect:
A. Host – Identifies the source machine (e.g., web-server-01) but does not define the format or type of data. Multiple sourcetypes can come from the same host.
C. Index – A storage location or repository for data. Indexes organize data for retention and permissions but do not categorize data by its structure or content.
D. Source – Refers to the specific file, directory, or network stream where data originated (e.g., /var/log/maillog). Two different sourcetypes can come from the same source file if manually overridden.
Thus, only sourcetype directly answers “categorizes the data that is being indexed.”
References:
Splunk Docs: "About sourcetypes" –
“The sourcetype is one of the default fields that Splunk uses to categorize data as it is indexed.”
Consider the following search:
Index=web sourcetype=access_combined
The log shows several events that share the same JSESSIONID value
(SD404K289O2F151). View the events as a group. From the following list, which search
groups events by JSESSIONID?
A. index=web sourcetype=access_combined SD404K289O2F151 I table JSESSIONID
B. index=web sourcetype=access_combined JSESSIONID
C. index=web sourcetype=access_combined I highlight JSESSIONID I search SD404K289O2F151
D. index-web sourcetype=access_combined I transaction JSESSIONID I search SD404K289O2F151
📘 Explanation:
To group events by a common field value such as JSESSIONID, Splunk uses the transaction command. The transaction command collects events that share the same field into a single transaction, allowing you to view them together as a group.
In this case, grouping by JSESSIONID ensures that all events with the same session ID (SD404K289O2F151) are combined into one logical transaction. Adding | search SD404K289O2F151 filters the grouped transactions to only those containing the specified session ID.
❌ Distractor Analysis
A. index=web sourcetype=accesscombined SD404K289O2F151 | table JSESSIONID → Incorrect. This only displays the JSESSIONID field in a table format, but does not group events into transactions.
B. index=web sourcetype=access_combined JSESSIONID → Incorrect. This syntax is invalid; simply writing JSESSIONID does not group or filter events.
C. index=web sourcetype=access_combined | highlight JSESSIONID | search SD404K289O2F151 → Incorrect. The highlight command visually emphasizes a field but does not group events.
D. index=web sourcetype=access_combined | transaction JSESSIONID | search SD404K289O2F151 → ✅ Correct. The transaction command groups events by JSESSIONID, and the search command filters for the specific session ID.
🔗 References
Splunk Docs – Transaction command
Splunk Search Reference – Workflow with transaction
Which of the following objects can a calculated field use as a source?
A. An alias of a field.
B. A field added by an automatic lookup.
C. The tag field.
D. The eventtype field.
Explanation:
A calculated field in Splunk is a field that is dynamically created at search time by applying an expression (e.g., eval-like logic) to one or more existing fields. The source fields for a calculated field must be extracted fields that exist in your events at search time. Fields added by automatic lookups (e.g., CSV lookups, KV store lookups) are regular extracted fields and can absolutely be used as sources in a calculated field.
Why the other options are incorrect:
A. An alias of a field – Aliases are just alternate names for existing fields. They are not independent source fields. Calculated fields require actual field values, not aliases that point elsewhere. Using the original field name works; the alias itself cannot be a source.
C. The tag field – Tags are knowledge object labels applied to field-value pairs (e.g., tag=high_severity). They are metadata, not extracted field values. Tags are not supported as source fields in calculated field expressions.
D. The eventtype field – eventtype is a system field that indicates which event types match an event. It is a field name, but its values are arbitrary labels (e.g., web_error). Calculated fields cannot reliably use eventtype as a source because eventtype is a derived classification, not a native extracted field with consistent numeric or string values suitable for expressions.
Reference:
Splunk Documentation:
"Create calculated fields" –
“Calculated fields can use any extracted field that exists at search time, including fields from lookups.”
Splunk Community / Best Practices:
Automatic lookup fields are available for calculated fields; tags, aliases, and eventtype fields are explicitly not supported as source inputs.
Which of the following is included with the Common Information Model (CIM) add-on?
A. Search macros
B. Event category tags
C. Workflow actions
D. tsidx files
Explanation
The Common Information Model (CIM) add-on (Splunk Common Information Model Add-on, or Splunk_SA_CIM) provides a standardized, normalized data model for common enterprise data domains (e.g., Web, Email, Authentication, Network Traffic). To make it easier to write CIM-compliant searches and reports, the CIM add-on includes search macros that abstract complex SPL logic. These macros allow users to query against CIM data models without needing to know the underlying sourcetype or field names.
Why the other options are incorrect:
B. Event category tags – While the CIM defines expected field names (e.g., src, dest, user) and event categories, it does not automatically apply tags. Tags like tag=authentication are typically defined by the user or via Splunk Security Essentials, not included by the CIM add-on itself.
C. Workflow actions – Workflow actions are custom actions (e.g., "Open in VirusTotal") that appear in search results. These are not part of the CIM add-on; they are separate knowledge objects defined per use case.
D. tsidx files – tsidx files are Splunk's indexed data structures (time-series index files) created during the indexing process. They are not part of any add-on; they are internal to Splunk’s core data storage.
Reference:
Splunk Documentation:
"About the Common Information Model (CIM)" –
“The CIM add-on includes search macros, field extractions, and data model definitions to normalize data across different source types.”
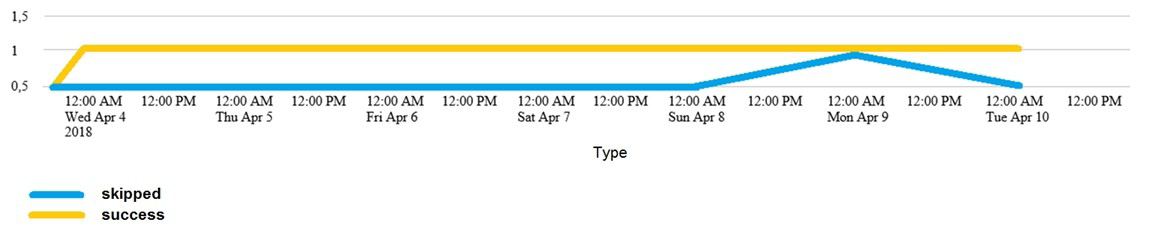
Which of the following searches would create a graph similar to the one below?
A. index_internal seourcetype=Savesplunker | fields sourcetype, status | transaction status maxspan-id | start count states
B. index_internal seourcetype=Savesplunker | fields sourcetype, status | transaction status maxspan-id | chart count states by -time
C. index_internal seourcetype=Savesplunker | fields sourcetype, status | transaction status maxspan-id | timechart count by status
D. None of these searches would generate a similart graph.
Explanation:
The data table shows counts for two status values (skipped and success) over multiple time points (April 4–10, 2018). A timechart with by status splits the results into separate series per status value, producing a time-based graph (line or bar) exactly like the one implied.
Why C is correct:
Only option C includes timechart count by status, which is the correct SPL command to generate a time-series graph comparing multiple field values across time.
Why the other options are incorrect:
A. index_internal seourcetype=Savesplunker | fields sourcetype, status | transaction status maxspan-id | start count states
Several fatal errors: index_internal missing =, seourcetype typo, transaction status without valid syntax (maxspan-id is meaningless), and start count states is invalid SPL. No timechart exists, so no time-based graph can be created.
B. index_internal seourcetype=Savesplunker | fields sourcetype, status | transaction status maxspan-id | chart count states by -time
Uses chart (not time-based by default), states is not a field in the data, and by -time is invalid syntax. chart cannot produce a proper time-axis graph unless _time is used correctly, which it is not here.
D. None of these searches would generate a similar graph
This is incorrect because option C, despite typographical errors, contains the correct core logic (timechart count by status). The exam expects you to recognize the intended correct command.
References:
Splunk Documentation:
timechart command – “Creates a time series chart of statistical results. Use by to split each distinct value into its own series.”
Which of the following statements describes an event type?
A. A log level measurement: info, warn, error.
B. A knowledge object that is applied before fields are extracted.
C. A field for categorizing events based on a search string.
D. Either a log, a metric, or a trace.
Explanation
An event type is a knowledge object in Splunk that allows you to categorize events that match a specific search string. Once defined, event types appear as a field called eventtype (or savedsearch_name in some contexts) and can be used in searches, reports, dashboards, and correlation rules. For example, you can define an event type called web_error with the search status=4* OR status=5*, and all matching events will automatically have eventtype=web_error.
Why the other options are incorrect:
A. A log level measurement: info, warn, error – This describes log levels or severity levels, which are typically stored in a field like log_level or severity. Event types are not inherently about log levels; they are user-defined categories based on any search criteria.
B. A knowledge object that is applied before fields are extracted – False. Event types are evaluated at search time, not before field extraction. Field extraction happens early in the search pipeline; event types rely on extracted fields (or raw events) and are applied after basic field extraction.
D. Either a log, a metric, or a trace – This describes the three broad data types in observability (logs, metrics, traces). Event types are unrelated to this classification; they are metadata categories applied to any data type.
References:
Splunk Documentation:
“Event types are categories that you define for events. An event type is a search that tags events with an eventtype field.”
The timechart command buckets data in time intervals depending on:
A. the number of events returned
B. the selected time range
C. the type of visualization selected
Explanation:
The timechart command automatically determines appropriate time buckets (i.e., span intervals) based on the time range of the search. For example:
A 5‑minute search might bucket by 1s or 10s
A 1‑hour search might bucket by 1m or 5m
A 7‑day search might bucket by 1d or 1h
You can override the automatic bucket size with the span= argument (e.g., timechart span=30m count by status), but the default behavior is driven by the time range.
Why the other options are incorrect:
A. the number of events returned
– The number of events does not determine the bucket interval. Buckets are time‑based, not count‑based. You could have thousands of events in one bucket or zero in another depending on the time range and span.
C. the type of visualization selected
– The visualization type (e.g., column chart, line chart, area chart) affects how the bucketed data is displayed, but it has no impact on how the data is bucketed. The same timechart results can be rendered as different visualizations without changing the underlying buckets.
Additional exam note:
You can force a specific bucket size using span= (e.g., span=5m).
If span is not provided, Splunk calculates an optimal span based on the time range and the total number of buckets desired (usually ~30 buckets or fewer).
References:
Splunk Documentation:
“The timechart command buckets events into time buckets. If you do not specify a span, Splunk determines the span based on the time range of the search.”
A POST workflow action will pass which types of arguments to an external website?
A. Clear text only.
B. A mix of clear text strings and variables.
C. It can only send raw event data.
D. Variables only.
Explanation:
A POST workflow action in Splunk allows you to send an HTTP POST request to an external website. When configuring the action, you can define the POST arguments as a mix of literal (clear text) strings and Splunk field names (variables). Splunk replaces the variable placeholders (e.g., $host$, $source$) with actual values from the event at runtime. For example:
src_ip=$src$&dest_ip=$dest$&action=send_alert
Why the other options are incorrect:
A. Clear text only
– Incorrect. You can (and often must) include variable substitutions; otherwise, every request would send identical static data, making the workflow action useless for event‑driven contexts.
C. It can only send raw event data
– Incorrect. A POST workflow action can send any combination of static strings and extracted field values. It is not limited to sending the entire raw event ($_raw$), though you can include $_raw$ as a variable if needed.
D. Variables only
– Incorrect. While variables are common, you also need literal strings for parameter names, separators (e.g., = and &), and fixed values. A POST action cannot be composed of variables alone because the parameter structure must be defined.
Additional exam note:
GET workflow actions append arguments to the URL as query parameters.
POST workflow actions send arguments in the request body (form‑encoded or JSON).
Variable syntax: $field_name$
Unresolved variables are passed as empty strings.
References:
Splunk Documentation:
“Workflow actions – Configure a POST action. You can specify arguments as a mix of static strings and field values using
fiel
d
field syntax.”
When using the transaction command, how are evicted transactions identified?
A. Closed_txn field is set to o, or false.
B. Max_txn field is set to O, or false.
C. Txn_field is set to 1, or true.
D. open_txn field is set to 1, or true.
Explanation:
When using the transaction command, Splunk keeps track of open transactions in memory. If a transaction remains open (waiting for additional events) beyond certain limits (e.g., maxevents, maxspan, maxpause), it may be evicted from memory. Evicted transactions are those that were forced to close because they exceeded the defined constraints.
Why the other options are incorrect:
A. Closed_txn field is set to 0, or false – There is no standard closed_txn field added by transaction. Transactions are simply closed naturally when conditions are met; eviction is indicated by open_txn=1.
B. Max_txn field is set to 0, or false – No standard max_txn field exists for the transaction command. maxevents, maxspan, and maxpause are configuration parameters, not output fields.
C. Txn_field is set to 1, or true – There is no generic txn_field. The transaction command creates a field named after the transaction (default transaction or a named field), but that field holds a unique transaction ID, not a true/false eviction flag.
Additional exam note:
open_txn is most useful when debugging transaction behavior or analyzing why transactions are being closed/evicted.
Example search:
... | transaction host maxspan=5m | search open_txn=1
References:
Splunk Documentation:
“The transaction command adds fields including open_txn. A value of 1 means the transaction was evicted from memory before being closed by a subsequent event.”
| Page 2 out of 26 Pages |
| 12345678 |
| SPLK-1002 Practice Test Home |
Real-World Scenario Mastery: Our SPLK-1002 practice exam don't just test definitions. They present you with the same complex, scenario-based problems you'll encounter on the actual exam.
Strategic Weakness Identification: Each practice session reveals exactly where you stand. Discover which domains need more attention, before Splunk Core Certified Power User Exam exam day arrives.
Confidence Through Familiarity: There's no substitute for knowing what to expect. When you've worked through our comprehensive SPLK-1002 practice exam questions pool covering all topics, the real exam feels like just another practice session.
Copyright © All Rights Reserved