
Topic 2: Questions Set 2
Which of the following is true about data model attributes?
A. They cannot be created within the data model.
B. They can only be added into a root search dataset.
C. They cannot be edited if inherited from a parent dataset.
D. They can be added to a dataset from search time field extractions.
Explanation:
Data model attributes are the fields that make up a dataset within a data model. They define what data is available for reporting and analysis. These attributes can be derived from search-time field extractions, meaning that fields extracted from your data (using regex, delimiters, or other methods) can be added as attributes to a data model dataset.
❌ Why the other options are incorrect
A. They cannot be created within the data model. – This is false. Attributes are created within the data model dataset. You define attributes by specifying the field name and optional settings like whether it's required, whether it's a multivalue field, and if it's editable.
B. They can only be added into a root search dataset. – This is false. Attributes can be added to any dataset within a data model, including child datasets. They are not restricted to root search datasets.
C. They cannot be edited if inherited from a parent dataset. – This is false. In Splunk, if a child dataset inherits an attribute from a parent dataset, the child dataset can override or modify the inherited attribute's settings (e.g., making it required or changing its type). It is not locked.
References
Splunk Documentation – Data Model Attributes:
"Attributes are the fields that make up a dataset. They can be added from search-time field extractions."
A calculated field may be based on which of the following?
A. Fields generated within a search string
B. Lookup tables
C. Regular expressions
D. Extracted fields
Explanation
A calculated field in Splunk is a search‑time knowledge object that applies an eval expression to create a new field or modify an existing one. It can only be based on extracted fields—fields that have already been extracted from the raw event data at search time. These include fields from automatic extraction (e.g., _time, host, sourcetype), inline extractions (EXTRACT-), or field transforms (REPORT-). The eval expression in a calculated field cannot reference fields that are generated later in the search processing order, such as lookup outputs or tags.
❌ Why the other options are incorrect
A. Fields generated within a search string
– This is not a standard concept. Fields are generated by commands like eval, stats, or lookup. Calculated fields are processed before most search‑time commands, so they cannot reference fields created within the search string.
B. Lookup tables
– Lookups are processed after calculated fields in the search‑time knowledge object order. Therefore, a calculated field cannot reference fields added by a lookup. If you try, Splunk will not be able to resolve the field.
C. Regular expressions
– Regex is a method for extracting fields, not a source field itself. A calculated field can reference the output of a regex extraction (i.e., an extracted field), but not the regex itself.
References
Splunk Documentation – Calculated Fields:
"Calculated fields can reference all types of field extractions. They cannot reference lookups, event types, or tags."
What is the purpose of the fillnull command?
A. Replace empty values with a specified value.
B. Create a new field based on the values in an existing field.
C. Rename a specific field in the search results.
D. Replace all values in a specific field with a default value.
Explanation:
The fillnull command in Splunk is used to replace null or empty values in specified fields with a value you define. By default, if you do not specify a value, it replaces nulls with 0. For example, | fillnull value=0 replaces all null values in the results with 0, and | fillnull value="N/A" status replaces null values in the status field with "N/A".
❌ Why the other options are incorrect
B. Create a new field based on the values in an existing field. – This describes the eval command, not fillnull. eval can create new fields using expressions, arithmetic, string manipulation, and conditional logic.
C. Rename a specific field in the search results. – This describes the rename command, which changes the name of a field in the output.
D. Replace all values in a specific field with a default value. – This is partially close but not accurate. fillnull only replaces null/empty values, not all values. If a field already has a non‑null value, fillnull leaves it unchanged.
📚 References
Splunk Documentation – fillnull command:
"The fillnull command replaces null values with a specified value."
SPLK-1002 Exam Blueprint:
Search Commands → fillnull → Purpose and usage.
Clicking a SEGMENT on a chart, ________.
A. drills down for that value
B. highlights the field value across the chart
C. adds the highlighted value to the search criteria
Explanation:
When you click a segment on a chart (e.g., a bar, slice, or line point) in Splunk, the action performs a drilldown for that specific value. This means Splunk automatically refines the search to focus on the data represented by that segment, opening a new search or updating the current one with the corresponding field value(s) as additional criteria. This is a core interactive feature of Splunk dashboards and visualizations.
❌ Why the other options are incorrect
B. highlights the field value across the chart
– Clicking a segment does not simply highlight the value across the chart. It initiates a drilldown search, which is a more significant action that changes the search context.
C. adds the highlighted value to the search criteria
– This is partially true but incomplete. Drilldown does add the value to the search criteria, but more importantly, it re‑runs the search with that added criteria. The action is not just "adding" it; it is executing a new search based on the click.
📚 References
Splunk Documentation – Chart Drilldown:
"Clicking a segment on a chart drills down for that value, adding it to the search criteria and re‑running the search."
When you mouse over and click to add a search term this (these. Boolean operator(s) is (are. not implied. (Select all that apply).
A. OR
B. ( )
C. AND
D. NOT
Explanation:
When interacting with the Splunk Web User Interface, clicking on elements within your search results (such as field values in the events viewer or items inside the fields sidebar) automatically updates your ad-hoc search query. This interactive behavior relies on specific logical assumptions built into the Splunk Search Processing Language (SPL) engine.
Why A, B, and D are Correct (They are NOT implied)
A. OR:
Splunk never implies a logical disjunction (OR) when you click to add terms sequentially. If you run a search for status=500 and then click on a user ID value like user=jdoe from the results list, Splunk will narrow your search criteria to find events containing both elements. It will not assume you want either one or the other. To achieve an OR condition, you must manually type the capitalized OR operator between the terms in the search bar.
B. ( ) Parentheses:
Parentheses are used in SPL to enforce the order of operations, especially when mixing different Boolean operators like AND and OR. Clicking to add multiple terms simply appends them to the end of the query string. Splunk will not automatically wrap your selections in parenthetical groups. Any complex structural grouping must be typed in manually by the user.
D. NOT:
Clicking a value in the interface always instructs Splunk to include that specific value in the search criteria. It never defaults to an exclusion (NOT). If your goal is to filter out an event attribute (e.g., ensuring a certain host is omitted), you cannot simply click it directly to add it; instead, you must select the "Exclude from search" option from the context menu, or manually prepend the capitalized NOT operator in the search line.
Why C is Incorrect
C. AND:
This operator is incorrect because it is implicitly applied by Splunk. In SPL, any consecutive terms written next to each other without an explicit operator are automatically treated as a logical intersection. For example, if your initial query is index=main and you click a field value for sourcetype=access_combined, your search string transforms into index=main sourcetype=access_combined. Splunk processes this exactly as if you had written index=main AND sourcetype=access_combined. Since the question asks which operators are not implied, AND must be excluded from your selections.
Reference:
Splunk Documentation: Search Manual -> Use Boolean expressions in searches.
Splunk Documentation: Search Manual -> Interact with search results.
Which command is used to create choropleth maps?
A. geostats
B. cluster
C. geom
Explanation:
The geom command is the primary SPL command used to create choropleth maps. It adds a geom field to each event, which contains geographic data structures for polygon geometry in JSON format. This geometry is what allows the Splunk visualization interface to render the shaded regions on the map .
In a typical workflow, you aggregate your data to create a statistics table (often using stats), and then pipe that table to the geom command. This command associates your aggregated data with the specific geographic boundaries (e.g., counties, states, countries) from a geospatial lookup file .
❌ Why the other options are incorrect
A. geostats:
The geostats command is used to generate statistics and display them on a map, but it is specifically for creating point-based maps or cluster maps (like bubble charts on a world map), not choropleth maps. It generates statistics by clustering events based on latitude and longitude coordinates, not by drawing shaded polygons for predefined regions .
B. cluster:
"Cluster" is not a standard Splunk search command used for mapping. While the geostats command clusters events into geographical bins, there is no standalone cluster command for creating choropleth maps .
📚 References
Splunk Docs - geom command: "The geom command adds a field, named geom, to each result. This field contains geographic data structures for polygon geometry in JSON. These geographic data structures are used to create choropleth map visualizations" .
Splunk Docs - Choropleth Map Tutorial: "Add the following to your search to associate the polygons in your geospatial lookup file with the corresponding county row using the geom command" .
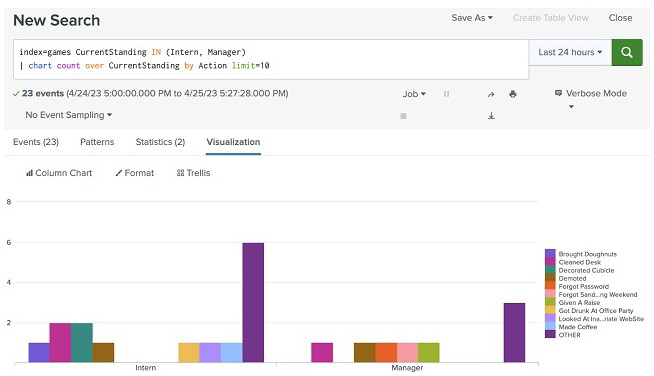
How could the following syntax for the chart command be rewritten to remove the OTHER category? (select all that apply)
A. | chart count over CurrentStanding by Action useother=f
B. | chart count over CurrentStanding by Action usenull-f useother-t
C. | chart count over CurrentStanding by Action limit=10 useother=f
D. | chart count over CurrentStanding by Action limit-10
Explanation:
By default, when using a by clause with a transforming command like chart or timechart, Splunk restricts the number of distinct data series columns it displays to prevent visualizations from becoming cluttered. Splunk automatically enforces a default parameter of limit=10. Any distinct series values that fall outside of the top 10 highest frequencies are automatically grouped together into a catch-all category named "OTHER".
Why A and C are Correct
The useother argument: To explicitly completely suppress or remove this automatic grouping behavior, you must append the argument useother=f (or useother=false) to the end of your chart command.
Option C keeps the existing constraint (limit=10) while adding useother=f, which tells Splunk to show only the top 10 series columns and silently discard any additional series instead of combining them into an "OTHER" category.
Option A is also valid because if you omit the limit argument entirely, Splunk still defaults internally to limit=10. Appending useother=f works perfectly here as well to turn off the "OTHER" category generation.
Why B and D are Incorrect
Option B contains major syntax errors. It uses dashes instead of equal signs (usenull-f useother-t) which will break the search parser completely. Furthermore, setting useother=t explicitly instructs Splunk to keep the "OTHER" category enabled.
Option D is exactly identical to the original search syntax displayed in the provided screenshot image. It keeps the default behaviors intact, which means the "OTHER" category column will remain visible in the resulting chart.
Reference:
Splunk Documentation: Search Reference -> chart.
Parameter Definitions:Under the chart command options, useother is a Boolean option that defaults to true (t). To prevent the search engine from grouping excess data series into the OTHER column, you must explicitly declare useother=false or useother=f.
In which Settings section are macros defined?
A. Fields
B. Tokens
C. Advanced Search
D. Searches, Reports, Alerts
Explanation:
In Splunk, search macros are defined in the Settings > Advanced Search > Search macros section. This is the dedicated area in Splunk Web where users with appropriate permissions can create, edit, and manage reusable pieces of SPL (Search Processing Language). Once a macro is defined, it can be called in any search by enclosing its name in backticks (e.g., `my_macro`).
❌ Why the other options are incorrect
A. Fields
– This section is used to manage field-related knowledge objects, including field extractions, field aliases, and calculated fields. It does not contain any options for defining or managing search macros. Macros are a separate category of knowledge objects.
B. Tokens
– Tokens are used in dashboards and forms to dynamically pass values between panels or to make visualizations interactive. They are not used for defining search macros. Tokens are defined within dashboard source code, not in the Settings menu.
D. Searches, Reports, Alerts
– This section is for managing saved searches, reports, and alert configurations. While macros can be used within these objects, the macros themselves are not defined here. This section is for scheduling, permissions, and triggering actions, not for macro creation.
📚 References
Splunk Documentation – Search Macros:
"Select Settings > Advanced Search > Search macros to create a search macro."
The gauge command:
A. creates a single-value visualization
B. allows you to set colored ranges for a single-value visualization
C. creates a radial gauge visualization
Explanation:
The gauge command takes a single numeric result and renders it as a radial gauge chart. This is useful for displaying KPIs like "current CPU usage," "system uptime," or "percentage of goals met."
You can pair the gauge command with stats or other aggregation commands to produce a single value.
❌ Why the other options are incorrect
A. creates a single-value visualization – While the gauge does display a single value, this description is too broad. The gauge command specifically creates a radial gauge, not just any single-value visualization.
B. allows you to set colored ranges for a single-value visualization – Setting colored ranges for single-value visualizations is a feature of the Single Value visualization, not the gauge command. Colored ranges are configured in the visualization settings, not via the gauge command itself.
📚 References
Splunk Docs: gauge command.
Splunk Docs: Single-value visualizations.
Which statement is true?
A. Pivot is used for creating datasets.
B. Data model are randomly structured datasets.
C. Pivot is used for creating reports and dashboards.
D. In most cases, each Splunk user will create their own data model.
Explanation:
The Pivot tool in Splunk is a visual, drag‑and‑drop interface that allows users to create reports and dashboards without writing SPL. It works on top of accelerated data models, enabling non‑technical users to explore data, build tables, charts, and visualizations, and save them as reports or add them to dashboards.
❌ Why the other options are incorrect
A. Pivot is used for creating datasets.
– This is false. Pivot is used for creating reports and visualizations, not datasets. Datasets are created within data models by knowledge managers. Pivot consumes datasets, it does not create them.
B. Data models are randomly structured datasets. – This is false. Data models are hierarchically structured datasets with defined constraints and attributes. They are carefully designed by knowledge managers to provide a consistent view of data. They are not "randomly structured."
D. In most cases, each Splunk user will create their own data model. – This is false. Data models are typically created by knowledge managers or administrators, not by every individual user. Most users only consume data models via Pivot, rather than creating them.
📚 References
Splunk Documentation – Pivot:
"Pivot is a visual tool that enables you to create reports and dashboards without using the Splunk search language."
Select this in the fields sidebar to automatically pipe you search results to the rare command
A. events with this field
B. rare values
C. top values by time
D. top values
Explanation
In the Splunk fields sidebar, when you click on a specific field (e.g., status), you are presented with a set of options to analyze that field's values. One of these options is "rare values", which automatically appends | rare
❌ Why the other options are incorrect
A. events with this field – This option filters your search to only show events that contain the selected field, but it does not automatically pipe the results to the rare command.
C. top values by time – This is not a standard option in the fields sidebar. While you can view top values, the sidebar does not offer a "top values by time" option.
D. top values – This option appends | top
📚 References
Splunk Docs: Fields sidebar – Rare values option.
SPLK-1002 Exam Blueprint: Search Interface → Fields sidebar → Options available.
When should transaction be used?
A. Only in a large distributed Splunk environment.
B. When calculating results from one or more fields.
C. When event grouping is based on start/end values.
D. When grouping events results in over 1000 events in each group.
Explanation:
The transaction command is most appropriate when you need to group events based on start and end conditions (e.g., startswith="login" and endswith="logout"). It is designed to correlate related events that may span multiple sources or time periods, and it excels when you need to define explicit boundaries for a transaction.
❌ Why the other options are incorrect
A. Only in a large distributed Splunk environment. – This is false. transaction can be used in any Splunk environment, large or small. There is no requirement that it be used only in distributed deployments.
B. When calculating results from one or more fields. – This describes the stats command, which is more efficient for aggregation and summarization. transaction is for event grouping, not for calculating statistics.
D. When grouping events results in over 1000 events in each group. – This is false. By default, transaction has a limit of 1000 events per transaction (maxevents=1000). It is not designed for grouping large numbers of events; in fact, it will automatically split transactions that exceed this limit.
References
Splunk Documentation – transaction command:
"Use transaction to group events based on start and end conditions."
SPLK-1002 Exam Blueprint:
Search Commands → transaction → Appropriate use cases.
| Page 10 out of 26 Pages |
| 678910111213 |
| SPLK-1002 Practice Test Home |
Real-World Scenario Mastery: Our SPLK-1002 practice exam don't just test definitions. They present you with the same complex, scenario-based problems you'll encounter on the actual exam.
Strategic Weakness Identification: Each practice session reveals exactly where you stand. Discover which domains need more attention, before Splunk Core Certified Power User Exam exam day arrives.
Confidence Through Familiarity: There's no substitute for knowing what to expect. When you've worked through our comprehensive SPLK-1002 practice exam questions pool covering all topics, the real exam feels like just another practice session.
Copyright © All Rights Reserved