Topic 4, Misc. Questions
You create a dashboard by using the Microsoft Power Bl Service. The dashboard contains
a card visual that shows total sales from the current year. You grant users access to the
dashboard by using the viewer role on the workspace. A user wants to receive daily
notifications of the number shown on the card visual. You need to automate the
notifications. What should you do?
A.
Share the dashboard to the user.
B.
Create a subscription.
C.
Create a data alert.
D.
Tag the user in a comment.
Create a subscription.
Explanation:
You can subscribe yourself and your colleagues to the report pages, dashboards, and
paginated reports that matter most to you. Power BI e-mail subscriptions allow you to:
Decide how often you want to receive the emails: daily, weekly, hourly, monthly, or
once a day after the initial data refresh.
Choose the time you want to receive the email, if you choose daily, weekly, hourly,
or monthly.
Note: Email subscriptions don't support most custom visuals. The one exception is those
custom visuals that have been certified.
Email subscriptions don't support R-powered custom visuals at this time.
Reference:
https://docs.microsoft.com/en-us/power-bi/collaborate-share/service-report-subscribe
https://docs.microsoft.com/en-us/power-bi/create-reports/service-set-data-alerts
You have a dataset named Pens that contains the following columns:
Unit Price
Quantity Ordered
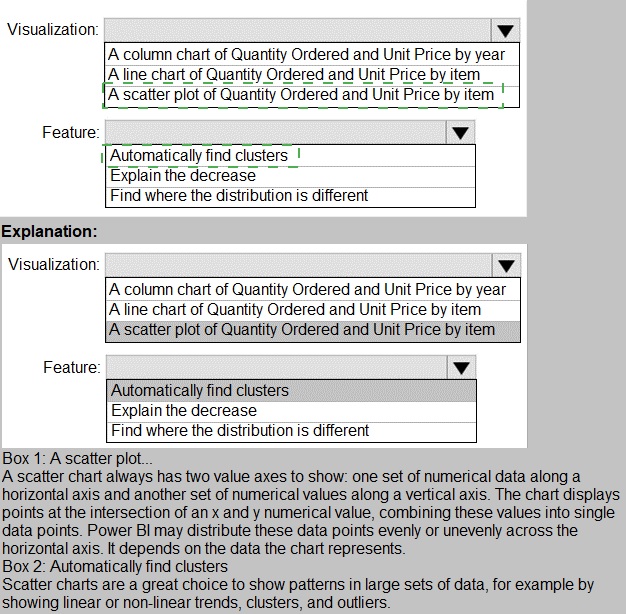
You need to create a visualization that shows the relationship between Unit Price and
Quantity Ordered. The solution must highlight orders that have a similar unit price and
ordered quantity.
Which type of visualization and which feature should you use? To answer, select the
appropriate options in the answer area.
NOTE: Each correct selection is worth one point.
You have a report that contains a bar chart and a column chart. The bar chart shows
customer count by
customer segment. The column chart shows sales by month.
You need to ensure that when a segment is selected in the bar chart, you see which
portion of the total sales for the month belongs to the customer segment.
How should the visual interactions be set on the column chart when the bar chart is
selected?
A.
no impact
B.
highlight
C.
filter
highlight
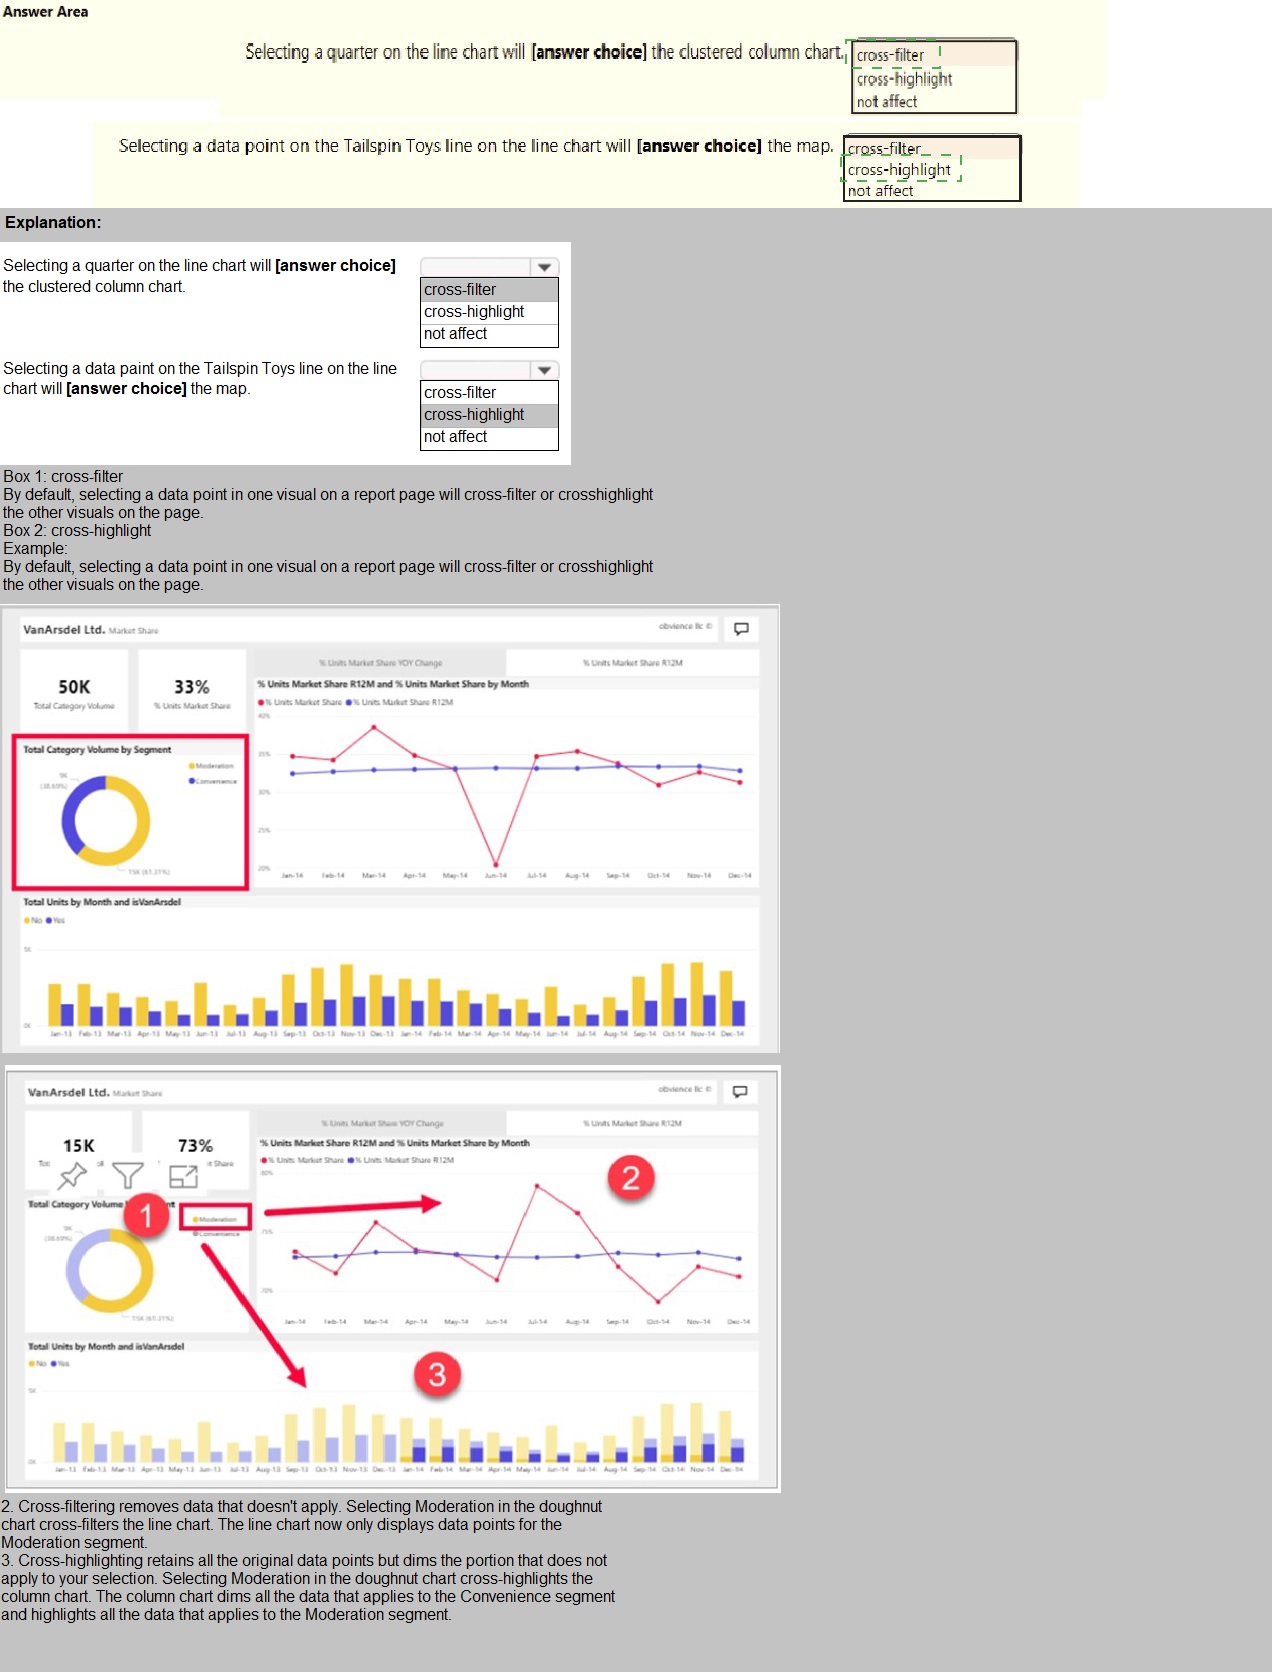
HIGHLIGHT as the question required us to "you see which portion of the total sales for the
month belongs to the customer segment" - in order to see WHICH portion, you need to still
see the whole visual, highlight is most appropriate. If the requirement stated to ONLY SEE
THE PORTION IT RELATES TO then filter would be appropriate.
You publish a Microsoft Power BI dataset to powerbi.com. The dataset appends data from
an on-premises Oracle database and an Azure SQL database by using one query.
You have admin access to the workspace and permission to use an existing On-premises
data gateway for which the Oracle data source is already configured.
You need to ensure that the data is updated every morning. The solution must minimize
configuration effort.
Which two actions should you perform when you configure scheduled refresh? Each
correct answer presents part of the solution.
NOTE: Each correct selection is worth one point.
A.
Configure the dataset to use the existing On-premises data gateway.
B.
Deploy an On-premises data gateway in personal mode.
C.
Set the refresh frequency to Daily.
D.
Configure the dataset to use the personal gateway
Configure the dataset to use the existing On-premises data gateway.
Set the refresh frequency to Daily.
Explanation:
https://docs.microsoft.com/en-us/power-bi/connect-data/service-gateway-personal-mode
You have two tables named Customers and Invoice in a Power BI model. The Customers
table contains the following fields:
CustomerID
Customer City
Customer State
Customer Name
Customer Address 1
Customer Address 2
Customer Postal Code
The Invoice table contains the following fields:
Order ID
Invoice ID
Invoice Date
Customer ID
Total Amount
Total Item Count
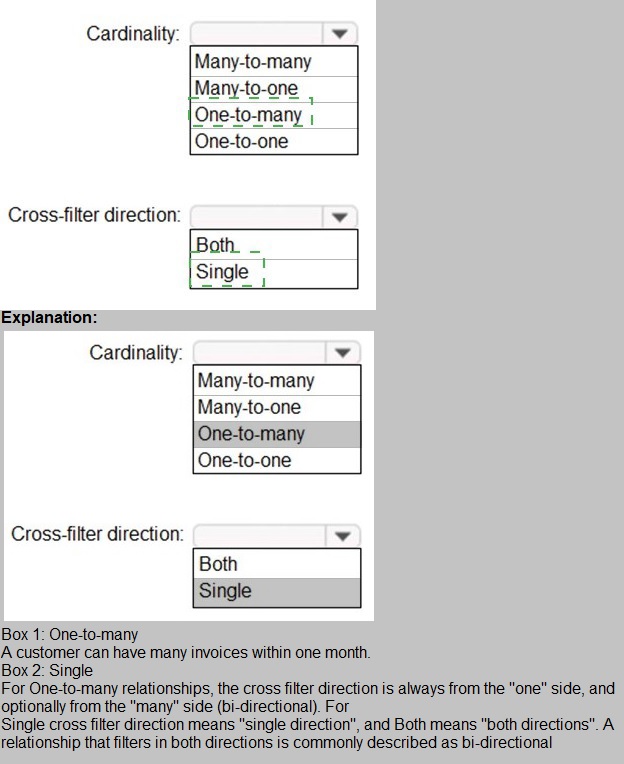
The Customers table is related to the Invoice table through the Customer ID columns. A
customer can have many invoices within one month.
The Power BI model must provide the following information:
The number of customers invoiced in each state last month
The average invoice amount per customer in each postal code
You need to define the relationship from the Customers table to the Invoice table. The
solution must optimize query performance.
What should you configure? To answer, select the appropriate options in the answer area.
NOTE: Each correct selection is worth one point.
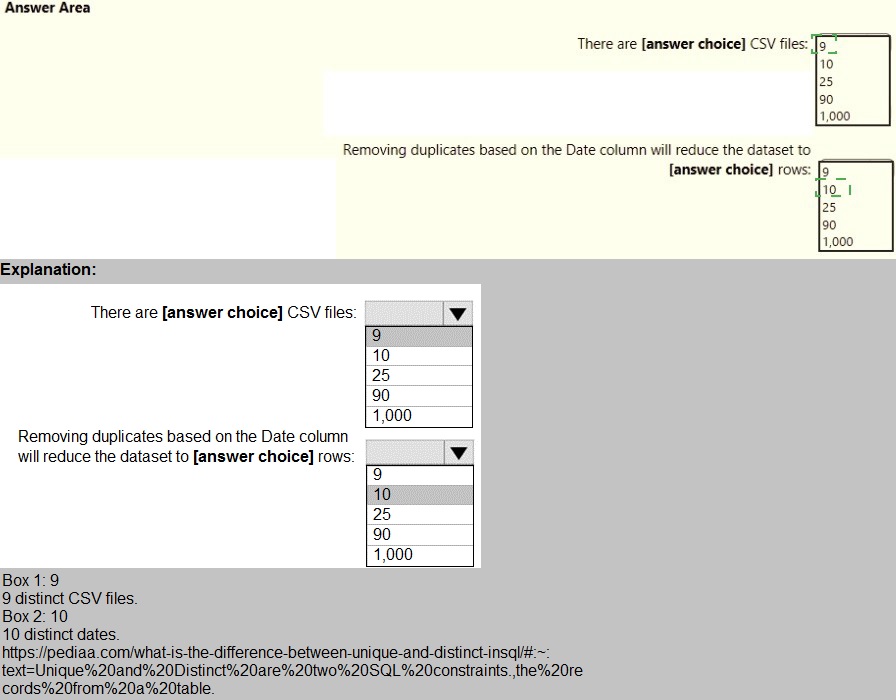
You view a query named Transactions as shown in the following exhibit.
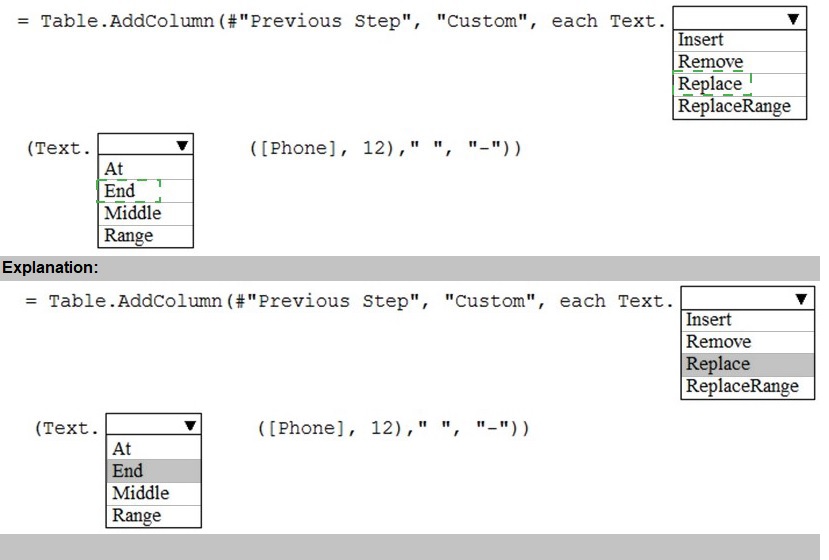
You have a table that contains a column named Phone. The following is a sample of the data in the Phone column.

You have four sales regions. Each region has multiple sales managers.
You implement row-level security (RLS) in a data model. You assign the relevant
distribution lists to each role.
You have sales reports that enable analysis by region. The sales managers can view the
sales records of their region. The sales managers are prevented from viewing records from
other regions.
A sales manager changes to a different region.
You need to ensure that the sales manager can see the correct sales data.
What should you do?
A.
From Microsoft Power Bl Desktop, edit the Row-Level Security setting for the reports.
B.
Change the Microsoft Power Bl license type of the sales manager.
C.
Manage the permissions of the underlying dataset
D.
Request that the sales manager be added to the correct Azure Active Directory group
Request that the sales manager be added to the correct Azure Active Directory group
Explanation:
Using AD Security Groups, you no longer need to maintain a long list of users.
All that you will need to do is to put in the AD Security group with the required permissions
and Power BI will do the REST! This means a small and simple security file with the
permissions and AD Security group.
Note: Configure role mappings
Once published to Power BI, you must map members to dataset roles.
Members can be user accounts or security groups. Whenever possible, we recommend
you map security groups to dataset roles. It involves managing security group
memberships in Azure Active Directory. Possibly, it delegates the task to your network
administrators.
Reference:
https://www.fourmoo.com/2018/02/20/dynamic-row-level-security-is-easy-with-activedirectory-
security-groups/
https://docs.microsoft.com/en-us/power-bi/guidance/rls-guidance
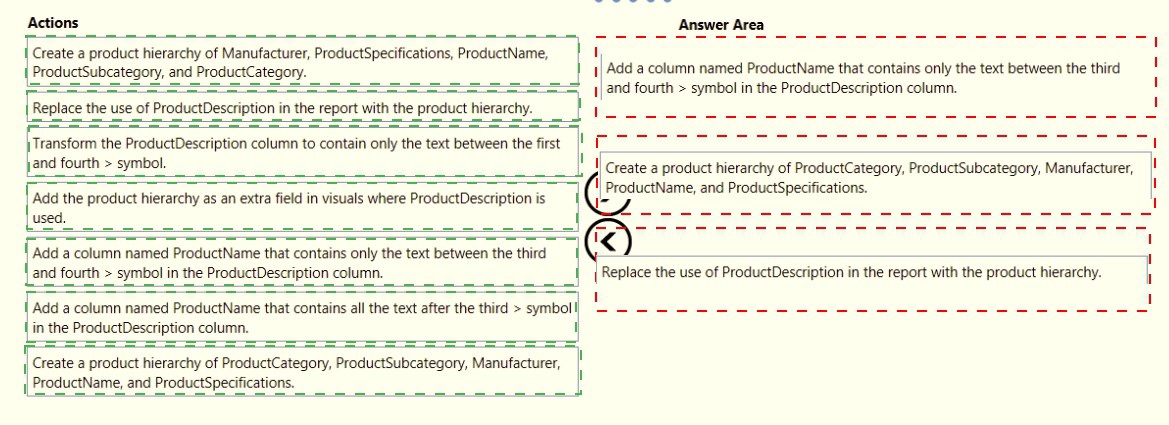
You build a report about warehouse inventory data. The dataset has more than 10 million
product records from 200 warehouses worldwide. You have a table named Products that
contains the columns shown in the following table.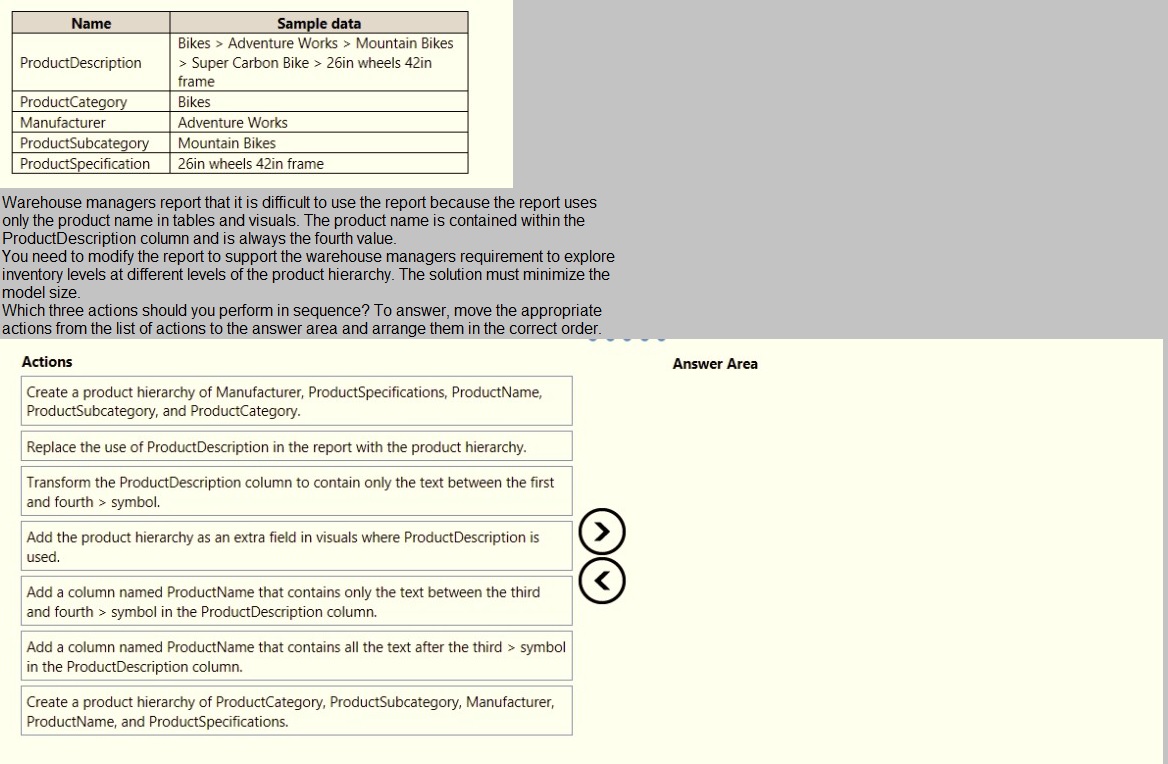
You open a query in Power Query Editor.
You need to identify the percentage of empty values in each column as quickly as possible. Which Data Preview option should you select?
A.
Show whitespace
B.
Column profile
C.
Column distribution
D.
Column quality
Column quality
Explanation:
Column quality: In this section, we can easily see valid, Error and Empty percentage of
data values associated with the Selected table.
Note: In Power Query Editor, Under View tab in Data Preview Section we can see the
following data profiling functionalities:
Column quality
Column distribution
Column profile
Reference:
https://community.powerbi.com/t5/Community-Blog/Data-Profiling-in-Power-BI-Power-BIUpdate-
April-2019/ba-p/674555
You have a report page that contains the visuals shown in the following exhibit.
Note: This question is part of a series of questions that present the same scenario.
Each question in the series contains a unique solution that might meet the stated
goals. Some question sets might have more than one correct solution, while others
might not have a correct solution.
After you answer a question in this section, you will NOT be able to return to it. As a
result, these questions will not appear in the review screen.
You are modeling data by using Microsoft Power BI. Part of the data model is a large
Microsoft SQL Server table named Order that has more than 100 million records.
During the development process, you need to import a sample of the data from the Order
table.
Solution: From Power Query Editor, you import the table and then add a filter step to the
query.
Does this meet the goal?
A.
Yes
B.
No
Yes
| Page 9 out of 25 Pages |
| Previous |