Topic 4, Misc. Questions
You have a sales system that contains the tables shown in the following table.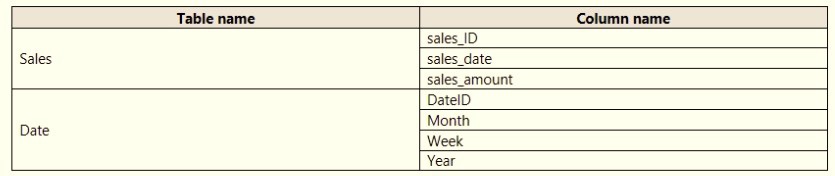
The Date table is marked as a date table.
DatelD is the date data type. You need to create an annual sales growth percentage measure. Which DAX expression should you use?
A.
SUM(sales[sales_amount]) - CALCULATE(SUM(sales[sales_amount]),
SAMEPERIODLASTYEAR('Date'[DateID])
B.
(SUM(‘Sales’[sales_amount]) - CALCULATE(SUM(‘Sales’[sales_amount]),
SAMEPERIODLASTYEAR(‘Date’[DateID])))
/ CALCULATE(SUM(‘Sales’[sales_amount]), SAMEPERIODLASTYEAR(‘Date’[DateID]))
C.
CALCULATE(SUM(sales[sales_amount]), DATESYTD(‘Date’[DateID]))
D.
CALCULATE(SUM(sales[sales_amount]), SAMEPERIODLASTYEAR(‘Date’[DateID]))
(SUM(‘Sales’[sales_amount]) - CALCULATE(SUM(‘Sales’[sales_amount]),
SAMEPERIODLASTYEAR(‘Date’[DateID])))
/ CALCULATE(SUM(‘Sales’[sales_amount]), SAMEPERIODLASTYEAR(‘Date’[DateID]))
SAMEPERIODLASTYEAR returns a table that contains a column of dates shifted one year
back in time from the dates in the specified dates column, in the current context.
Reference:
https://docs.microsoft.com/en-us/dax/sameperiodlastyear-function-dax
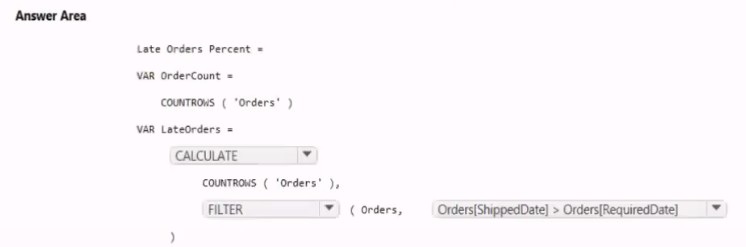
You need to create a measure that will return the percentage of late orders.
How should you complete the DAX expression? To answer, select the appropriate options in the answer area. NOTE: Each correct selection is worth one point.
You have the data lineage shown in the following exhibit.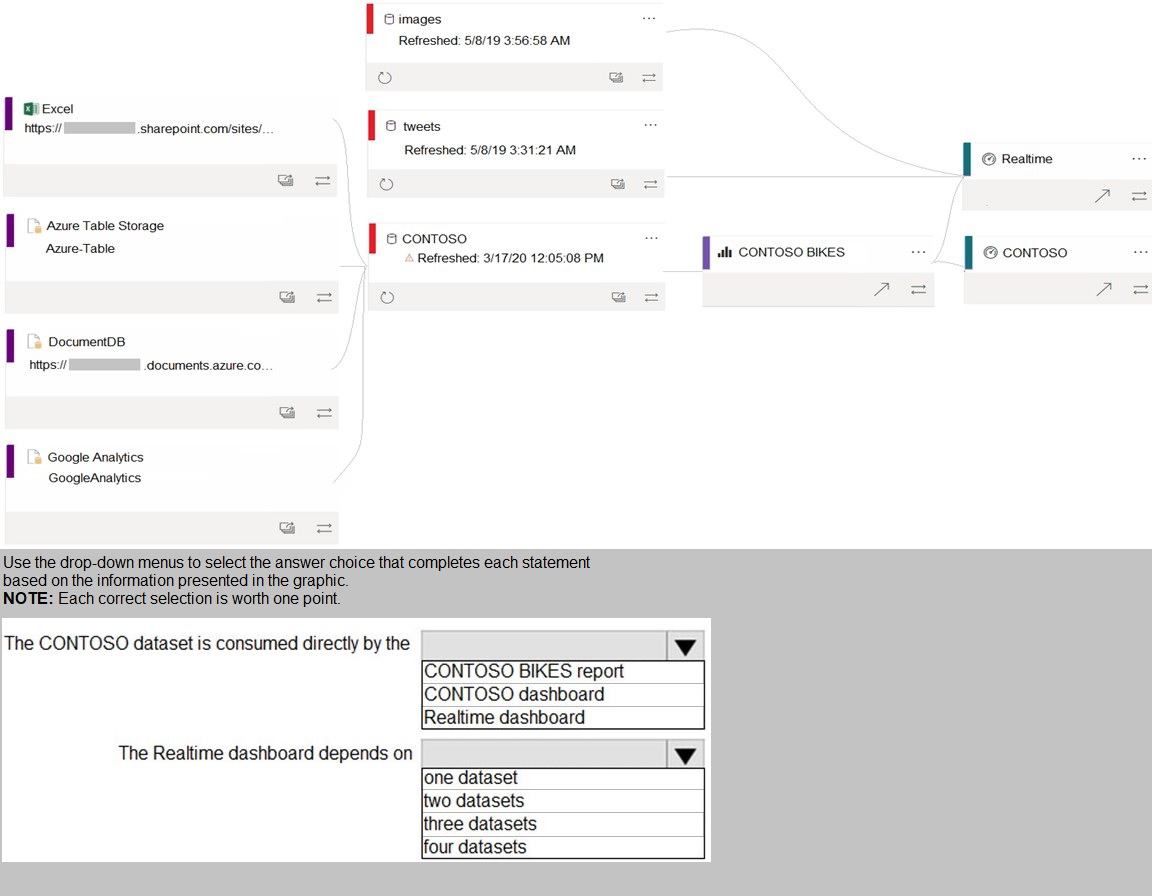
You create the following step by using Power Query Editor.
=
Table.ReplaceValue(SalesLT_Address,"1318","1319",Replacer.ReplaceText,{"AddressLine
1"})
A row has a value of 21318 Lasalle Street in the AddressLine1 column. What will the value
be when the step is applied?
A.
1318
B.
1319
C.
21318 Lasalle Street
D.
21319 Lasalle Street
21319 Lasalle Street
Explanation:
Example:
Replace the text "ur" with the text "or" in the table
ion have a Power BI dataset that contains a table named Temperature Readings.
Temperature Readings contains the columns shown in the following table.
The table has 12 million rows. All the columns are needed for analysis.
You need to optimize the dataset to decrease the model size. The solution must not affect
the precision of the data.
What should you do?
A.
Split the DateTime column into separate date and time columns.
B.
Disable the Power Query load.
C.
Round the Longitude column two decimal places.
D.
Change the data type of the TempCelsius column to Integer
Disable the Power Query load.
Explanation:
Disable Power Query load.
Power Query queries that are intended support data integration with other queries should
not be loaded to the model. To avoid loading the query to the model, take care to ensure
that you disable query load in these instances.
Reference:
https://docs.microsoft.com/en-us/power-bi/guidance/import-modeling-datareduction#
disable-power-query-query-load
Note: This question is part of a series of questions that present the same scenarioEach question in the series contains a unique solution that might meet the stated
goals. Some question sets might have more than one correct solution, while others
might not have a correct solution.
After you answer a question in this scenario, you will NOT be able to return to it. As
a result, these questions will not appear in the review screen.
You have several reports and dashboards in a workspace.
You need to grant all organizational users read access to a dashboard and several reports.
Solution: You publish an app to the entire organization.
Does this meet the goal?
A.
Yes
B.
No
Yes
Explanation: https://docs.microsoft.com/es-es/power-bi/collaborate-share/service-createdistribute-
apps
You have a table that contains the following three columns:
City
Total Sales
Occupation
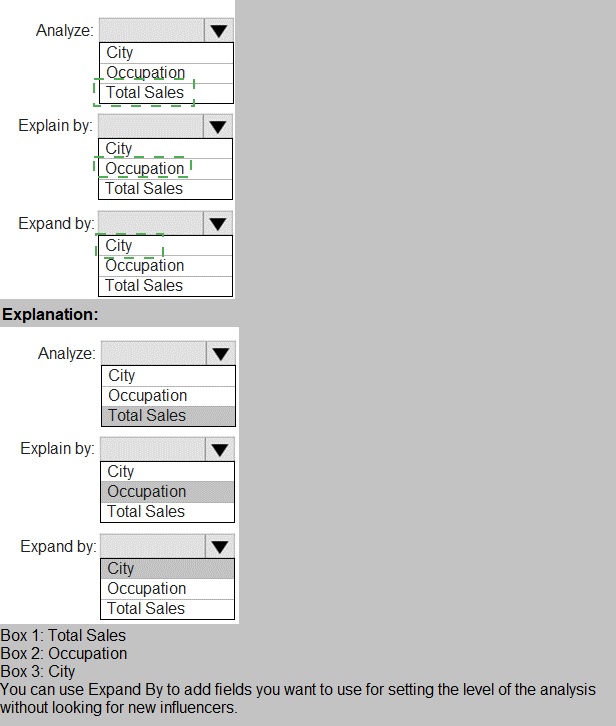
You need to create a key influencers visualization as shown in the exhibit. (Click the Exhibit tab.)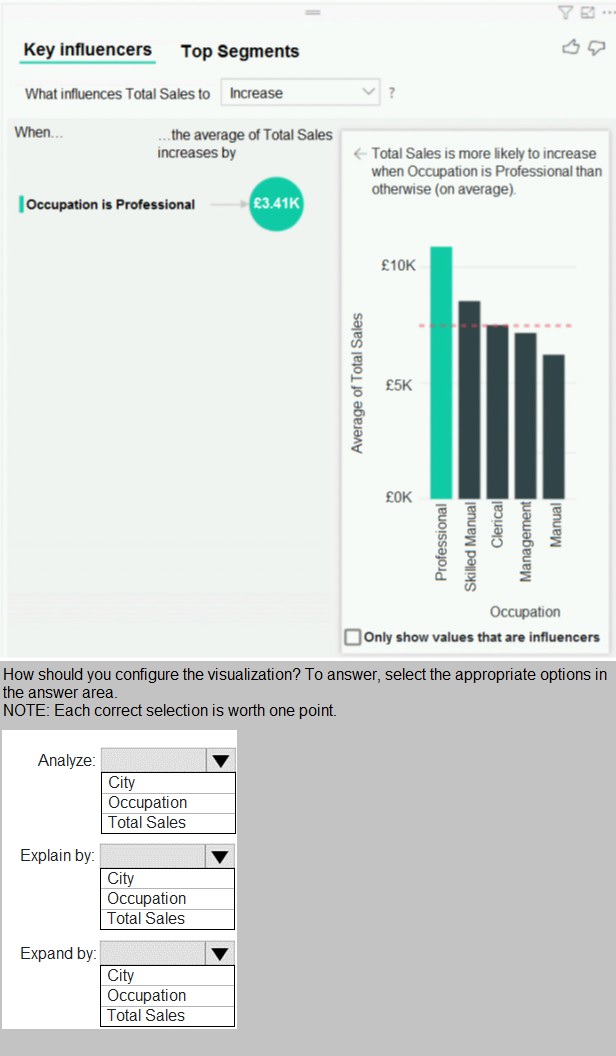
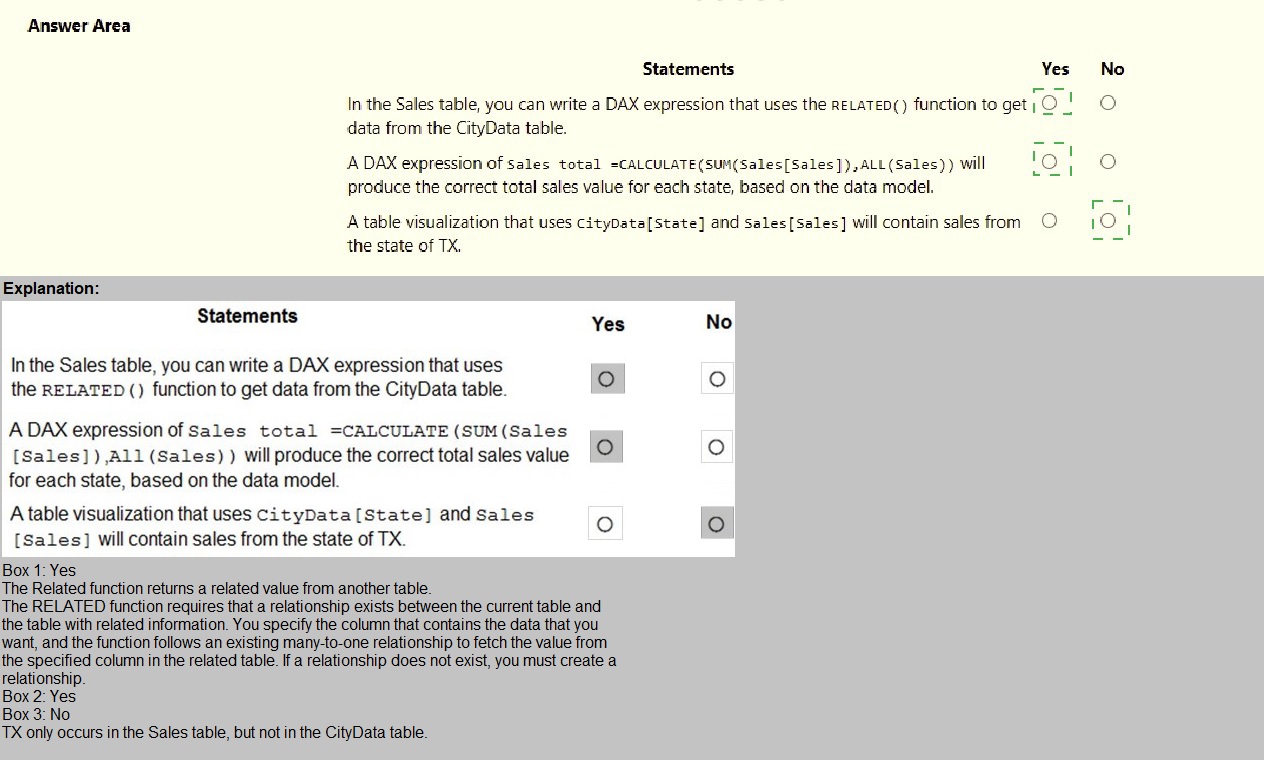
You are creating a Microsoft Power Bl model that has two tables named CityData and Sales. CityData contains only the data shown in the following table.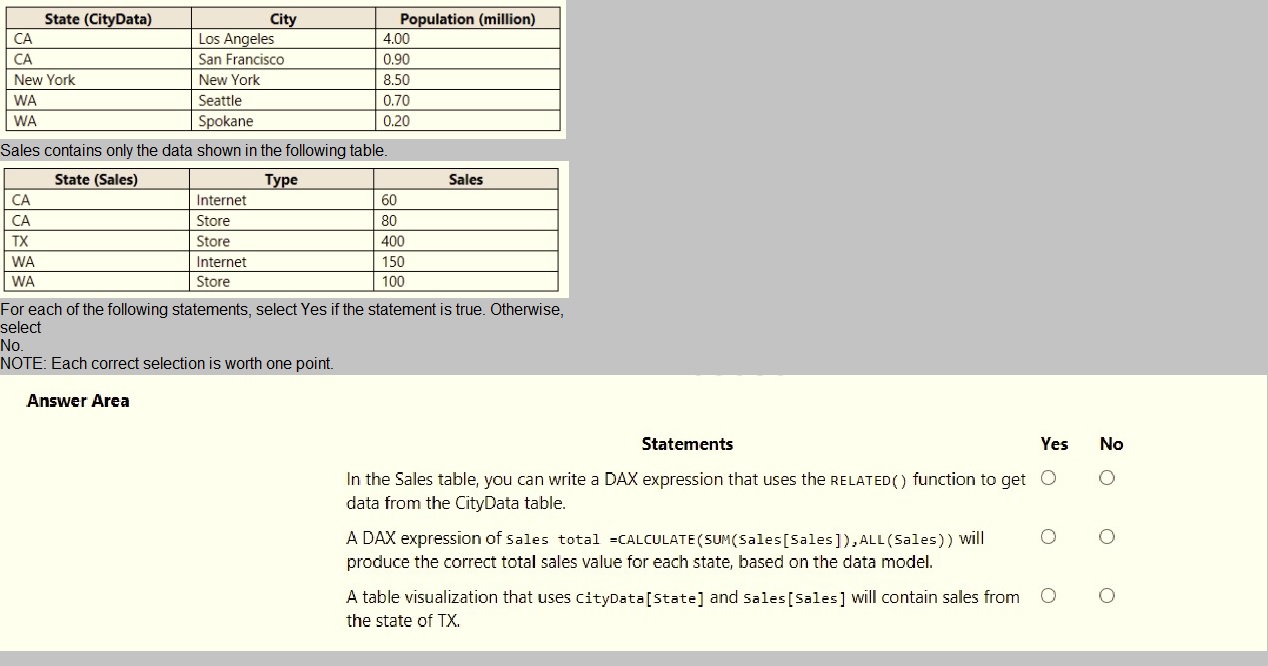
You have multiple dashboards.
You need to ensure that when users browse the available dashboards from powerbi.com.
they can see which dashboards contain Personally Identifiable Information (Pll). The
solution must minimize configuration effort and impact on the dashboard design.
What should you use?
A.
Active Directory groups
B.
tiles
C.
data classifications
D.
comments
Active Directory groups
Note: This question is part of a series of questions that present the same scenario. Each question in the series contains a unique solution that might meet the stated goals. Some question sets might have more than one correct solution, while others might not have a correct solution.
After you answer a question in this section, you will NOT be able to return to it. As a
result, these questions will not appear in the review screen.
You have a Power BI model that contains two tables named Sales and Date. Sales
contains four columns named TotalCost, DueDate, ShipDate, and OrderDate. Date
contains one column named Date.
The tables have the following relationships:
Sales[DueDate] and Date[Date]
Sales[ShipDate] and Date[Date]
Sales[OrderDate] and Date[Date]
The active relationship is on Sales[DueDate].
You need to create measures to count the number of orders by [ShipDate] and the orders
by [OrderDate]. You must meet the goal without duplicating data or loading additional data.
Solution: You create measures that use the CALCULATE, COUNT, and
USERELATIONSHIP DAX functions.
Does this meet the goal?
A.
Yes
B.
No
Yes
Explanation:
References:
https://docs.microsoft.com/en-us/dax/calculate-function-dax
https://docs.microsoft.com/en-us/dax/count-function-dax
https://docs.microsoft.com/en-us/dax/userelationship-function-dax
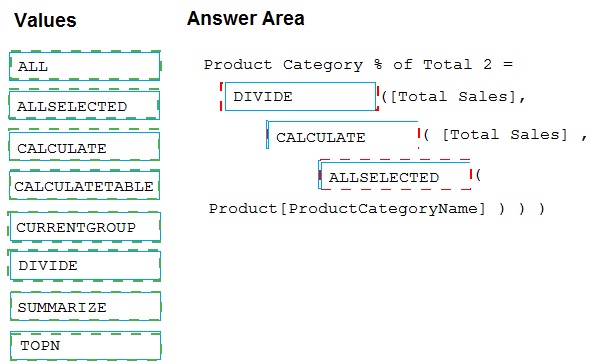
You have a Microsoft Power BI data model that contains three tables named Sales,
Product, and Date.
The Sales table has an existing measure named [Total Sales] that sums the total sales
from the Sales table.
You need to write a calculation that returns the percentage of total sales that a selected
ProductCategoryName value represents. The calculation must respect any slicers on
ProductCategoryName and must show the percentage of visible total sales. For example, if
there are four ProductCategoryName values, and a user filters one out, a table showing
ProductCategoryName and the calculation must sum up to 100 percent.
How should you complete the calculation? To answer, drag the appropriate values to the
correct targets. Each value may be used once, more than once, or not at all. You may need
to drag the split bar between panes or scroll to view content.
NOTE: Each correct selection is worth one point.
You have an Azure SQL database that contains sales transactions. The database is
updated frequently.
You need to generate reports from the data to detect fraudulent transactions. The data
must be visible within five minutes of an update.
How should you configure the data connection?
A.
Add a SQL statement.
B.
Set Data Connectivity mode to DirectQuery.
C.
Set the Command timeout in minutes setting.
D.
Set Data Connectivity mode to Import.
Set Data Connectivity mode to DirectQuery.
With Power BI Desktop, when you connect to your data source, it's always possible to
import a copy of the data into the Power BI Desktop. For some data sources, an alternative
approach is available: connect directly to the data source using DirectQuery.
DirectQuery: No data is imported or copied into Power BI Desktop. For relational sources,
the selected tables and columns appear in the Fields list. For multi-dimensional sources
like SAP Business Warehouse, the dimensions and measures of the selected cube appear
in the Fields list. As you create or interact with a visualization, Power BI Desktop queries
the underlying data source, so you’re always viewing current data.
Reference:
https://docs.microsoft.com/en-us/power-bi/connect-data/desktop-use-directquery
| Page 8 out of 25 Pages |
| 4567891011 |
| PL-300 Practice Test Home |
Real-World Scenario Mastery: Our PL-300 practice exam don't just test definitions. They present you with the same complex, scenario-based problems you'll encounter on the actual exam.
Strategic Weakness Identification: Each practice session reveals exactly where you stand. Discover which domains need more attention, before Microsoft Power BI Data Analyst exam day arrives.
Confidence Through Familiarity: There's no substitute for knowing what to expect. When you've worked through our comprehensive PL-300 practice exam questions pool covering all topics, the real exam feels like just another practice session.
Copyright © All Rights Reserved