Topic 1, Litware, Inc. Case Study
This is a case study. Case studies are not timed separately. You can use as much exam
time as you would like to complete each case. However, there may be additional case
studies and sections on this exam. You must manage your time to ensure that you are able
to complete all questions included on this exam in the time provided.
To answer the questions included in a case study, you will need to reference information
that is provided in the case study. Case studies might contain exhibits and other resources
that provide more information about the scenario that is described in the case study. Each
question is independent of the other questions in this case study.
At the end of this case study, a review screen will appear. This screen allows you to review
your answers and to make changes before you move to the next section of the exam. After
you begin a new section, you cannot return to this section.
To start the case study
To display the first question in this case study, click the Next button. Use the buttons in the
left pane to explore the content of the case study before you answer the questions. Clicking
these buttons displays information such as business requirements, existing environment
and problem statements. If the case study has an All Information tab, note that the
information displayed is identical to the information displayed on the subsequent tabs.
When you are ready to answer a question, click the Question button to return to the
question.
Overview
Litware, Inc. is an online retailer that uses Microsoft Power Bl dashboards and reports.
The company plans to leverage data from Microsoft SQL Server databases, Microsoft
Excel files, text files, and several other data sources.
Litware uses Azure Active Directory (Azure AD) to authenticate users.
- Existing Environment
Sales Data
Litware has online sales data that has the SQL schema shown in the following table.
In the Date table, the dateid column has a format of yyyymmdd and the month column has
a format of yyyymm. The week column in the Date table and the weekid column in the
Weekly_Returns table have a format of yyyyww. The regionid column can be managed by
only one sales manager.
Data Concerns
You are concerned with the quality and completeness of the sales data. You plan to verify
the sales data for negative sales amounts.
Reporting Requirements
Litware identifies the following technical requirements:
• Executives require a visual that shows sales by region.
• Regional managers require a visual to analyze weekly sales and returns.
• Sales managers must be able to see the sales data of their respective region only.
• The sales managers require a visual to analyze sales performance versus sales targets.
• The sale department requires reports that contain the number of sales transactions.
• Users must be able to see the month in reports as shown in the following example: Feb
2020.
• The customer service department requires a visual that can be filtered by both sales
month and ship month independently.
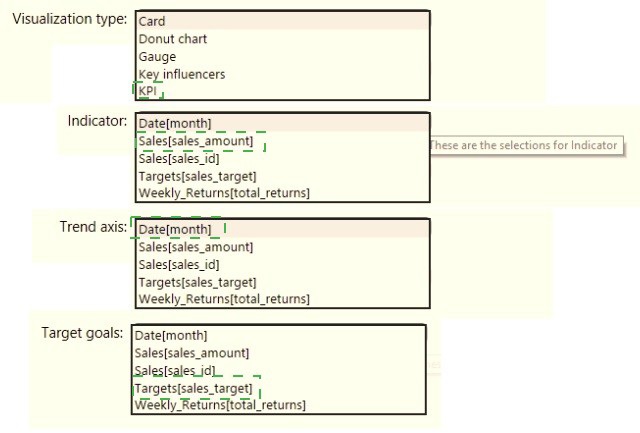
You need to create a visualization to meet the reporting requirements of the sales
managers.
How should you create the visualization? To answer, select the appropriate options in the
answer area.
NOTE: Each correct selection is worth one point.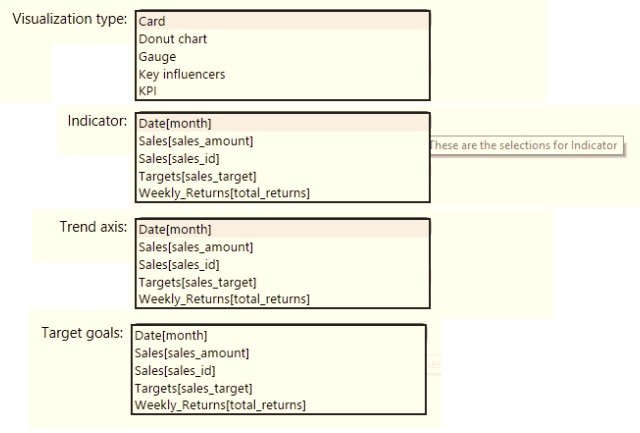
You need to create a relationship between the Weekly_Returns table and the Date table to meet the reporting requirements of the regional managers. What should you do?
A. In the Weekly.Returns table, create a new calculated column named date-id in a format of yyyymmdd and use the calculated column to create a relationship to the Date table.
B. Add the Weekly_Returns data to the Sales table by using related DAX functions.
C. Create a new table based on the Date table where date-id is unique, and then create a many-to-many relationship to Weekly_Return.
Explanation:
The scenario implies that the current Weekly_Returns table lacks a column that can correctly relate to the Date table, which is a standard practice for a "date dimension" or "calendar table" in a Power BI model. A proper relationship requires a single, unique date key to connect the two tables.
Let's analyze why this is the correct approach and why the others are not viable:
Why Option A is Correct:
This is the standard and most robust method for building a dimensional model in Power BI.
Problem Identification:
The Weekly_Returns table likely has a date column that cannot form a relationship, possibly because it's in a different data type (e.g., text) or format than the key in the Date table.
Solution:
Creating a new calculated column in the Weekly_Returns table using the yyyyymmdd format (e.g., 20231027) serves a critical purpose:
Standardization:
It creates a clean, numeric key that is consistent and sorts correctly.
Compatibility:
This key can be matched to a similarly formatted key in the Date table (which is a best practice for a date dimension).
Relationship:
Once both tables have a column with the same data type and format, you can create a standard one-to-many relationship (Date table on the "one" side, Weekly_Returns on the "many" side). This allows regional managers to slice and filter the weekly returns data by any attribute from the Date table (e.g., Year, Quarter, Month, Week).
Why the Other Options Are Incorrect:
B. Add the Weekly_Returns data to the Sales table by using related DAX functions.
Incorrect: This is not a method for creating a relationship. Merging data using DAX functions like RELATED is something you do after a relationship is established, not to create one. This approach would force you to denormalize the model unnecessarily and could lead to major performance issues and complexity. It does not solve the core problem of connecting Weekly_Returns to the Date table.
C. Create a new table based on the Date table where date-id is unique, and then create a many-to-many relationship to Weekly_Return.
Incorrect and Unnecessary: A well-designed Date table should already have a unique date-id (or a unique Date column) by definition. Creating a new table is redundant. More importantly, the relationship between a Date table and a fact table like Weekly_Returns should be a one-to-many relationship, not a many-to-many. A many-to-many relationship is complex, can negatively impact performance, and is only used for specific scenarios (like relating a Sales table to a Product table where the same product is sold by multiple business units). It is not the correct relationship type for a standard date dimension connection.
Reference:
Core Concept:
This question tests the fundamental skill of creating relationships in a Star Schema model. The key concepts are using a Date dimension table and creating compatible keys for one-to-many relationships.
Official Documentation:
Title: Model relationships in Power BI Desktop
Relevant Excerpt: "To create a relationship, you need to have at least one column in each table that contains similar data... The most common type of relationship is a one-to-many relationship."
You need to create a calculated column to display the month based on the reporting requirements. Which DAX expression should you use?
A. FORMAT('Date'[date], "MMM YYYY")
B. FORMAT('Date' [date], "M YY")
C. FORMAT('Date'[date_id], "MMM") & "" & FORMAT('Date'[year], "#")
D. FORMAT('Date' [date_id], "MMM YYYY")
Explanation:
The goal is to create a calculated column that displays the month and year in a readable reporting format, such as:
Jan 2025, Feb 2025, Mar 2025, etc.
Answer Breakdown
✅ A. FORMAT('Date'[date], "MMM YYYY")
Uses the FORMAT DAX function to convert a date into a text string.
"MMM" → Returns the abbreviated month name (e.g., Jan, Feb, Mar).
"YYYY" → Returns the four-digit year.
Combined result: Jan 2025, Feb 2025, etc.
✅ This is the most standard and readable month-year format for reporting.
Why the Other Options Are Incorrect
B. FORMAT('Date'[date], "M YY") ❌
Returns numeric month (e.g., 1 25) — not user-friendly for report visuals.
C. FORMAT('Date'[date_id], "MMM") & "" & FORMAT('Date'[year], "#") ❌
'date_id' is usually an integer key, not a date column — cannot be formatted as "MMM".
Also missing a space or separator between month and year.
D. FORMAT('Date'[date_id], "MMM YYYY") ❌
Again, 'date_id' is not a date data type. Using FORMAT on it will not produce valid month names.
Reference:
📘 Microsoft Learn — FORMAT function (DAX)
✅ Summary:
To show Month and Year (e.g., Jan 2025) in a calculated column, use:
What should you create to meet the reporting requirements of the sales department?
A. a measure that uses a formula of SUM (Sales [sales_id])
B. a calculated column that use a formula of COUNTA(sales [sales_id])
C. a measure that uses a formula of COUNTROWS (Sales)
D. a calculated column that uses a formula of SUM (Sales [sales_id])
Explanation:
The question asks for a solution to meet the reporting requirements of the sales department. While the specific requirement isn't stated, the most common and fundamental need for a sales department is to analyze key metrics like Total Sales Count dynamically across different filters and contexts (e.g., by date, by region, by product).
Let's analyze why a measure with COUNTROWS is the correct and versatile choice, and why the others are fundamentally flawed.
Why Option C is Correct:
Measures are for Dynamic Aggregation:
A measure is a DAX formula that is calculated dynamically based on the context of the report. When you place Total Sales Count = COUNTROWS(Sales) in a visual, it will correctly count the number of sales transactions for the selected time period, the selected region, or any other filter applied by the user. This is exactly what is needed for interactive reporting.
COUNTROWS(Sales) is the Correct Formula:
This function counts every row in the Sales table. Since each row in a typical Sales table represents a single sales transaction, this gives you the total count of sales. It is the standard and most efficient DAX function for this purpose.
Why the Other Options Are Incorrect:
A. a measure that uses a formula of SUM(Sales[sales_id])
Incorrect: This sums the values in the sales_id column. A sales_id is typically a unique identifier for each transaction (like 1, 2, 3,...). Summing these IDs produces a meaningless number that has no business relevance (e.g., the sum of IDs 1, 2, and 3 is 6). It does not give you the count of sales.
B. a calculated column that use a formula of COUNTA(sales[sales_id])
Incorrect: A calculated column is computed row-by-row when the data is refreshed and stored in the model. The COUNTA function, when used in a calculated column, will simply count the number of non-blank values in the current row's sales_id column. For every single row, this will return 1 (because each row has one sales_id). It does not provide a total count for reporting.
D. a calculated column that uses a formula of SUM(Sales[sales_id])
Incorrect:This is the most severely flawed option. Using an aggregation function like SUM in a calculated column creates a row context but no filter context. The formula does not know how to "see" the entire table. This will cause an error or, in some contexts, return the value of the sales_id for that specific row, which is not a sum at all. It fundamentally misunderstands how calculated columns work.
Reference:
Core Concept:
This question tests the fundamental difference between measures and calculated columns and the correct use of aggregation functions like COUNTROWS.
Measures vs. Calculated Columns:
Measures are for dynamic, context-aware calculations (like sums, counts, averages for reports). Calculated columns are for static, row-level values that are added to the model.
You need to provide a solution to provide the sales managers with the required access. What should you include in the solution?
A. Create a security role that has a table filter on the Sales_Manager table where username = UserName()
B. Create a security role that has a table filter on the Region_Manager table where sales_manager_id = UserPrincipalName().
C. Create a security role that has a table filter on the Sales_Manager table where name = UserName().
D. Create a security role that has a table filter on the Sales_Manager table where
Explanation:
This question refers to Row-Level Security (RLS) in Power BI — used to restrict data access based on the logged-in user.
Sales managers should only see their own sales data, so the solution must dynamically filter the dataset using the Power BI user identity at runtime.
Detailed Reasoning
✅ Option A: username = USERNAME()
You define a security role in Power BI Desktop (Model view → Manage roles).
On the Sales_Manager table, apply a DAX filter like:
[username] = USERNAME()
USERNAME() returns the currently logged-in user’s domain identity (e.g., domain\user or user@company.com
).
This ensures each sales manager only sees rows where their username matches the logged-in Power BI user.
✅ Correct and recommended practice for dynamic RLS.
Why the Other Options Are Incorrect
B. Table filter on Region_Manager with sales_manager_id = USERPRINCIPALNAME() ❌
The table Region_Manager is not relevant for the access requirement (it’s for regional data, not sales managers).
Also, mismatched field (sales_manager_id vs user identity string).
C. Table filter on Sales_Manager where name = USERNAME() ❌
name field usually holds the person’s display name (e.g., “John Doe”), which doesn’t match USERNAME() output (john.doe@contoso.com).
This mismatch means filters won’t apply correctly.
D. (Incomplete) ❌
The option is incomplete but even if similar to A, without the proper column match (username), it’s not valid.
Reference:
📘 Microsoft Learn — Row-level security (RLS) with Power BI
📘 Microsoft Learn — USERNAME() and USERPRINCIPALNAME() functions (DAX)
✅ Summary:
To restrict data per sales manager dynamically:
Create an RLS role on the Sales_Manager table,
Use this filter:
You need to create the required relationship for the executive's visual. What should you do before you can create the relationship?
A. Change the data type of Sales[region_id] to Whole Number.
B. the Sales table, add a measure for sum(sales_amount).
C. Change the data type of sales[sales_id] to Text.
D. Change the data type of sales [region_id] to Decimal Number.
📘 Explanation:
To create a relationship between two tables in Power BI, the data types of the related columns must match exactly. If you're trying to relate Sales[region_id] to another column—likely a Region table with region_id as a key—then both columns must have the same data type, typically Whole Number for ID fields.
Changing Sales[region_id] to Whole Number ensures compatibility with the related key column and allows Power BI to establish the relationship.
Reference:
🔗 Microsoft Learn – Create and manage relationships in Power BI Desktop
❌ Why other options are incorrect:
B. Add a measure for sum(sales_amount)
Measures are used for aggregations in visuals, not for establishing relationships. This action is irrelevant to relationship creation.
C. Change the data type of sales[sales_id] to Text
This affects a different column (sales_id), not region_id, and likely breaks relationships if the related key is numeric.
D. Change the data type of sales[region_id] to Decimal Number
Decimal Number is not appropriate for ID fields. It introduces precision issues and mismatches with Whole Number keys.
📘 summary:
Relationships in Power BI require matching data types. For ID-based joins, Whole Number is the correct and expected type.
Option A is the only valid action to enable relationship creation for the executive’s visual.
You need to address the data concerns before creating the data model. What should you do in Power Query Editor?
A.
Select Column distribution.
B.
Select the sales_amount column and apply a number filter.
C. Select Column profile, and then select the sales_amount column.
D. Transform the sales_amount column to replace negative values with 0.
Explanation:
To address data concerns before modeling in Power BI, the most effective diagnostic step is using Column profile in Power Query Editor. This tool provides detailed statistics for the selected column, including:
Count of valid,
empty, and error values
Minimum, maximum, mean, and standard deviation
Value distribution and frequency
These insights help identify outliers, nulls, and anomalies in the sales_amount column before any transformations or modeling. It’s the most comprehensive way to assess data quality and integrity.
Reference:
🔗 Microsoft Learn – Data profiling tools in Power Query
❌ Why other options are incorrect:
A. Select Column distribution
This shows only the frequency of values and distinct counts. It lacks deeper statistical insights like mean, min/max, and error detection. It’s useful but not sufficient for full data validation.
B. Apply a number filter to sales_amount
Filtering helps isolate values but doesn’t diagnose issues. You need to understand the data first—profiling comes before filtering.
D. Replace negative values with 0
This is a transformation, not a diagnostic step. You should first determine whether negative values are valid (e.g., refunds or losses) using profiling tools. Blind replacement risks distorting the data.
📘 Summary:
Use Column profile to inspect and validate the sales_amount column before modeling. It provides the most complete view of data health and helps ensure that transformations and relationships are built on clean, reliable data. Other options either lack depth, are premature, or risk altering valid data without proper analysis. This aligns with Power BI best practices for data preparation.
You need to create relationships to meet the reporting requirements of the customer service department. What should you create?
A. an additional date table named ShipDate, a one-to-many relationship from Sales[sales_date_id] to Date[date_id], and a one-to-many relationship from Sales[sales_ship_date_id] to ShipDate[date_id]
B. an additional date table named ShipDate, a many-to-many relationship from Sales[sales_date_id] to Date[date_id], and a many-to-many relationship from Sales[sales_ship_date_id] to ShipDate[date_id]
C. a one-to-many relationship from Date[date_id] to Sales[sales_date_id] and another oneto- many relationship from Date[date_id] to Weekly_Returns[week_id]
D. a one-to-many relationship from Sales[sales_date_id] to Date[date_id] and a one-tomany relationship from Sales[sales_ship_date_id] to Date[date_id]
E. a one-to-many relationship from Date[date_id] to Sales[sales_date_id] and another oneto- many relationship from Date[date_id] to Sales[sales_ship_date_id]
Explanation:
This scenario describes a common data modeling challenge known as role-playing dimensions. The Sales table has two different dates, each with a different meaning or "role":
sales_date_id: Likely represents the Order Date.
sales_ship_date_id: Represents the Ship Date.
The customer service department needs to analyze data by both of these dates independently (e.g., "How many orders were placed in January?" vs. "How many orders were shipped in January?").
Let's analyze why creating a second date table is the correct solution and why the other options fail.
Why Option A is Correct:
1.Role-Playing Dimensions:
A single Date table cannot actively filter the same Sales table in two different ways simultaneously. To solve this, you create a second, physically distinct copy of the date table, often named ShipDate.
2.Proper Relationships:
You then create two separate, standard one-to-many relationships:
Date[date_id] -> Sales[sales_date_id] (for analyzing by Order Date)
ShipDate[date_id] -> Sales[sales_ship_date_id] (for analyzing by Ship Date)
3.Meeting the Requirement:
In a report, a user can now use the Date table to filter and group by the order date, and use the ShipDate table independently to filter and group by the ship date. This perfectly meets the reporting needs of the customer service department.
Why the Other Options Are Incorrect:
B. ...many-to-many relationship...
Incorrect: There is no reason for a many-to-many relationship in this scenario. The relationships between a fact table (Sales) and a date dimension are inherently one-to-many (one date has many sales). Many-to-many relationships are complex, can hurt performance, and are only used for specific scenarios, not for standard date filtering.
C. a one-to-many relationship from Date[date_id] to Sales[sales_date_id] and another one-to-many relationship from Date[date_id] to Weekly_Returns[week_id]
Incorrect: This option does not address the sales_ship_date_id column at all. It introduces a relationship to a different table (Weekly_Returns) which is irrelevant to the stated requirement of meeting the customer service department's needs related to the two dates in the Sales table.
D. a one-to-many relationship from Sales[sales_date_id] to Date[date_id] and a one-to-many relationship from Sales[sales_ship_date_id] to Date[date_id]
Incorrect: You cannot create two active relationships between the same two tables in a Power BI model. If you create the second relationship, the first one becomes inactive. You can only have one active path for filter context. Therefore, you would only be able to analyze data by one of the dates effectively without constantly manually activating and deactivating relationships, which is not a viable reporting solution.
E. a one-to-many relationship from Date[date_id] to Sales[sales_date_id] and another one-to-many relationship from Date[date_id] to Sales[sales_ship_date_id]
Incorrect: This has the same fundamental flaw as option D. It attempts to create two relationships from the single Date table to the Sales table. This is not allowed in the model; one of these relationships would be inactive and useless for standard reporting.
Reference:
Core Concept: This question tests the understanding of role-playing dimensions and the standard solution of creating multiple physical copies of a dimension table to handle different date contexts.
Official Documentation:
Title: Role-playing dimensions
Relevant Excerpt: "A role-playing dimension is a dimension that can filter related facts in different contexts. The Date dimension is a common example... To support role-playing dimensions, import the dimension table one time for each role... For example, to support three roles for the Date dimension, you would import the Date table three times."
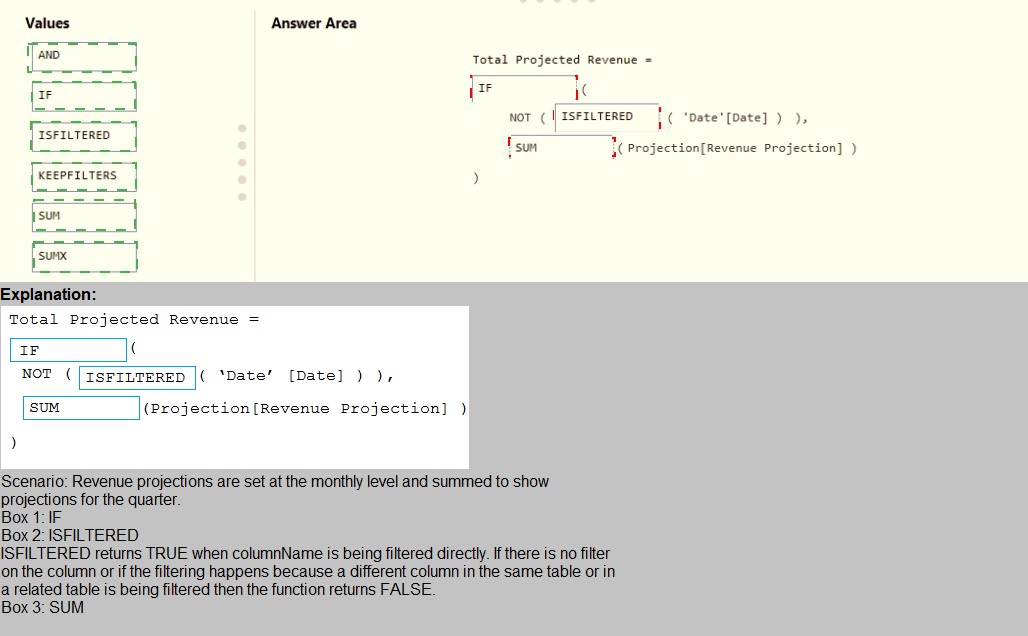
You need to create a DAX measure in the data model that only allows users to see
projections at the appropriate levels of granularity.
How should you complete the measure? To answer, drag the appropriate values to the
correct targets. Each value may be used once, more than once, or not at all. You may need
to drag the split bar between panes or scroll to view content.
NOTE: Each correct selection is worth one point.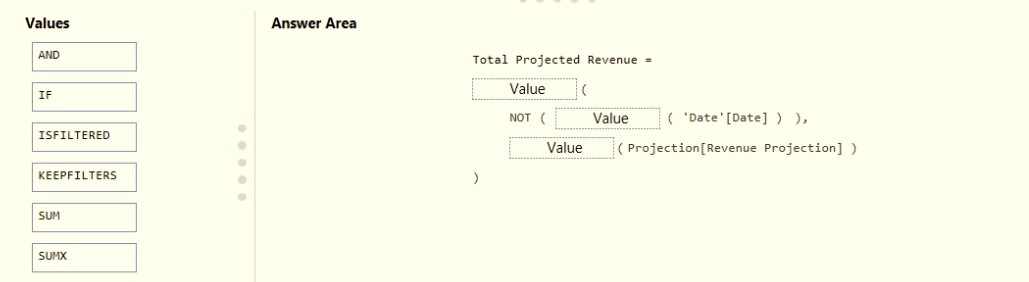
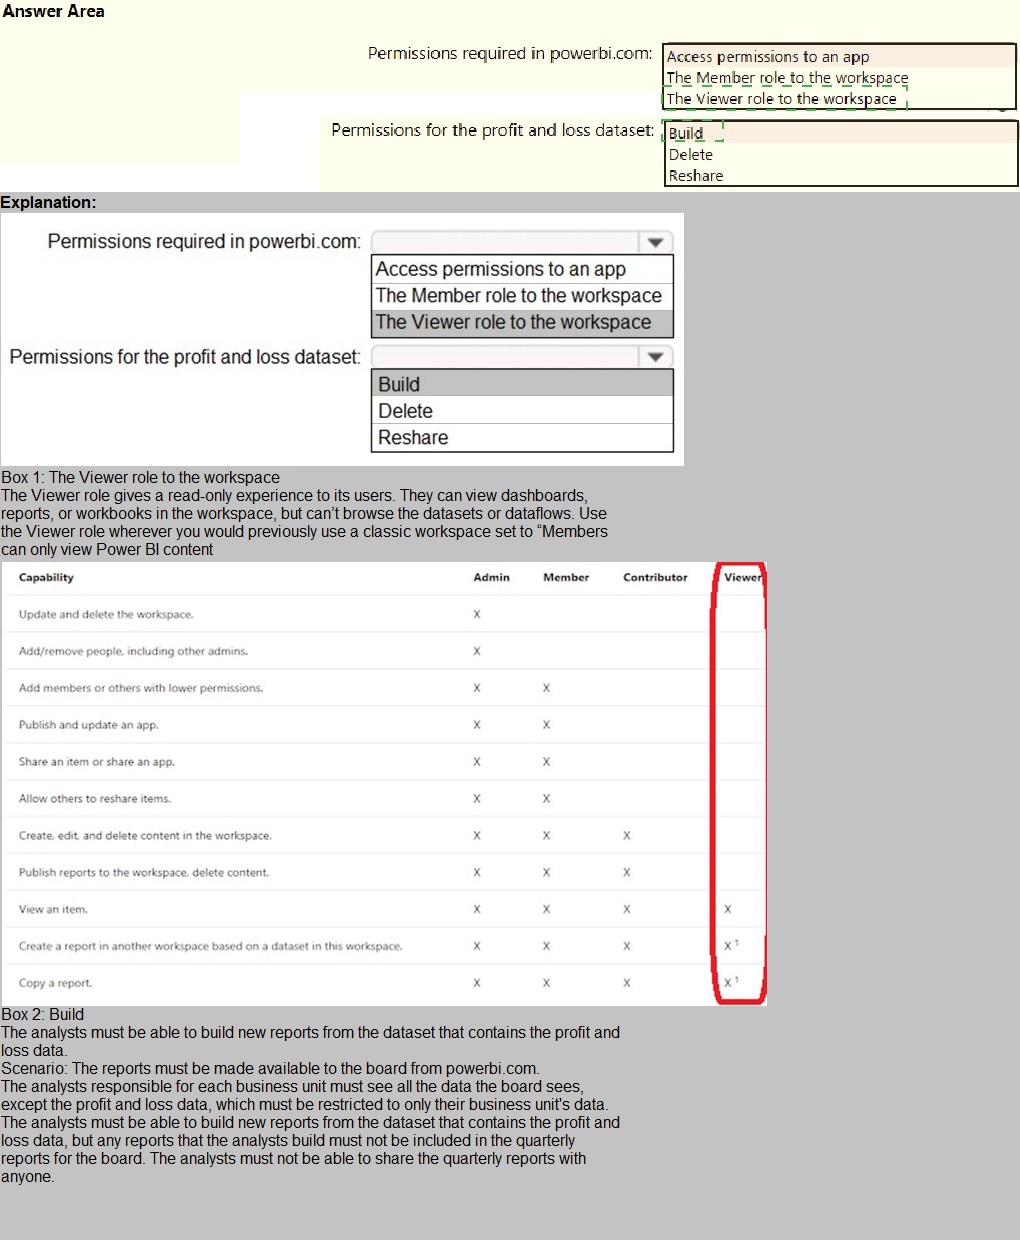
You need to grant access to the business unit analysts.
What should you configure? To answer, select the appropriate options in the answer area. NOTE: Each correct selection is worth one point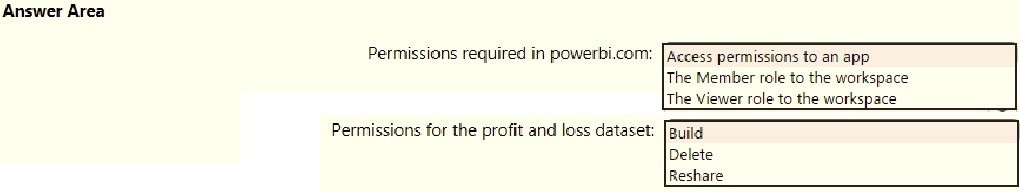
Which DAX expression should you use to get the ending balances in the balance sheet reports?
A. CALCULATE ( SUM( BalanceSheet [BalanceAmount] ), DATESQTD( 'Date'[Date] ) )
B. CALCULATE ( SUM( BalanceSheet [BalanceAmount] ), LASTDATE( 'Date'[Date] ) )
C. FIRSTNONBLANK ( 'Date' [Date] SUM( BalanceSheet[BalanceAmount] ) )
D. CALCULATE ( MAX( BalanceSheet[BalanceAmount] ), LASTDATE( 'Date' [Date] ) )
Explanation:
A balance sheet report shows a company's financial position at a specific point in time. The "ending balance" for any given period (e.g., a month, quarter, or year) is the balance as of the last day of that period.
Let's analyze why this expression correctly captures that logic and why the others are incorrect for this specific financial requirement.
Why Option B is Correct:
LASTDATE( 'Date'[Date] ):
This time intelligence function returns the last date in the current filter context. For example, if a user is looking at the year 2023, LASTDATE will return December 31, 2023. This is exactly the point in time for which we need the balance sheet amount.
CALCULATE ( SUM( ... ), ... ):
The CALCULATE function is used to modify the filter context. It takes the sum of all BalanceAmount and then forces that calculation to be performed only for the date returned by LASTDATE. This correctly yields the ending balance for the period.
Why the Other Options Are Incorrect:
A. CALCULATE ( SUM( BalanceSheet [BalanceAmount] ), DATESQTD( 'Date'[Date] ) )
Incorrect: DATESQTD (Dates Quarter-To-Date) returns a table of all dates from the beginning of the quarter up to the last date in the current context. It does not return a single date. This expression would sum the balance amounts for all days in the quarter-to-date period, which is meaningless for a balance sheet. A balance sheet is a snapshot, not an accumulation over time.
C. FIRSTNONBLANK ( 'Date' [Date], SUM( BalanceSheet[BalanceAmount] ) )
Incorrect: The FIRSTNONBLANK function is designed to return the first value in a column that is not blank. It is often used in semi-additive scenarios but is completely wrong for an ending balance. An ending balance requires the last date, not the first. This would return the balance from the beginning of the period.
D. CALCULATE ( MAX( BalanceSheet[BalanceAmount] ), LASTDATE( 'Date' [Date] ) )
Incorrect:
While it correctly uses LASTDATE to filter to the end of the period, it uses the MAX aggregation function. This would find the single largest balance amount on that last day. However, a balance sheet has many accounts (Assets, Liabilities, Equity), and we need the actual balance for each account, not the maximum value among them. Using SUM is correct because it aggregates the amounts for the specific account and date in context.
Reference:
Core Concept:
This question tests the understanding of semi-additive measures and the correct use of time intelligence functions in DAX. Balance sheet amounts are a classic example of semi-additive data; they cannot be summed over time but represent a snapshot at a point in time.
You need to recommend a strategy to consistently define the business unit, department, and product category data and make the data usable across reports. What should you recommend?
A. Create a shared dataset for each standardized entity.
B. Create dataflows for the standardized data and make the dataflows available for use in all imported datasets.
C. For every report, create and use a single shared dataset that contains the standardized data.
D. For the three entities, create exports of the data from the Power Bl model to Excel and store the data in Microsoft OneDrive for others to use as a source.
E.
📘 Explanation:
To ensure consistent definitions of business unit, department, and product category across multiple Power BI reports, the best strategy is to use Power BI dataflows. Dataflows allow you to:
Centralize and standardize data transformation logic
Reuse cleaned, structured entities across multiple datasets and reports
Maintain consistency and reduce duplication
Enable governance and version control over shared dimensions
By creating dataflows for these entities, you ensure that all reports referencing them use the same definitions, hierarchies, and formatting.
Reference:
🔗 Microsoft Learn – Self-service data prep in Power BI with dataflows
❌ Why other options are incorrect:
A. Create a shared dataset for each standardized entity
This leads to fragmentation. Multiple datasets increase maintenance overhead and reduce reusability across models.
C. Use a single shared dataset for every report
This limits flexibility. Not all reports need the same data model, and coupling all reports to one dataset can cause performance and governance issues.
D. Export to Excel and store in OneDrive
This is manual, error-prone, and lacks version control. It’s not scalable or secure for enterprise-grade reporting.
📘 Summary:
Dataflows are the recommended approach for reusable, governed, and standardized data entities in Power BI. They support consistent modeling across reports and align with Microsoft’s best practices for scalable BI architecture.
| Page 1 out of 25 Pages |