SOC Features, Incidents, and Automation
Which two types of variables can you use in playbook tasks? (Choose two.)
A. input
B. Output
C. Create
D. Trigger
Explanation:
Playbooks in Fortinet platforms like FortiSOAR or FortiAnalyzer use variables to make automation dynamic and flexible—they let tasks reference incoming data or results from previous steps, keeping everything connected without hardcoding values. This question tests your understanding of the two main variable types available for playbook tasks.
✅ Correct Answers: A. input and B. Output
A. input:
This one's spot on because input variables capture the data that kicks off the playbook, like trigger details from an event or API call. Think of them as the starting point—whatever comes in through the playbook trigger (say, an alert or webhook) gets stored here for tasks to reference using simple syntax like {{vars.input.records[0].name}}. They're essential for reacting to real-world events dynamically.
B. Output:
Perfect choice too—output variables hold results from playbook steps, making them reusable downstream. When a task like "Get User Info" finishes, its output gets stored automatically (often under vars.steps.
❌ Incorrect Answers:
C. Create:
Not a standard variable type in Fortinet playbooks. You might confuse this with actions like "Set Variable" steps that create custom vars, but those fall under local variables (like vars.myvar), not a distinct "Create" category. Common mix-up if you're thinking of general scripting languages.
D. Trigger:
Close but no cigar—triggers start playbooks, and their data flows into input variables, but "Trigger" isn't a usable variable type itself. It's more of an event mechanism (like a FortiGate log), not something you reference directly in tasks. People sometimes blur this with inputs, but they're distinct.
Reference: https://docs.fortinet.com
Which two ways can you create an incident on FortiAnalyzer? (Choose two answers)
A. Using a custom event handler
B. Using a connector action
C. Manually, on the Event Monitor page
D. By running a playbook
Explanation:
FortiAnalyzer lets you create incidents to track and investigate security events properly. You can do this manually when you spot something worth investigating, or set up automated rules (event handlers) that watch for specific patterns in logs and raise an incident automatically when those patterns match. Playbooks are more about running a sequence of automated actions (like enrichment, notifications, or remediation) after something happens, but in FortiAnalyzer 7.6, you can configure playbooks to create incidents as one of their tasks. Manual creation from the Event Monitor page and automatic creation via custom event handlers are two very common and directly supported methods.
Correct answers
✅ A. Using a custom event handler
This is correct. You can build (or modify) a custom event handler under Incidents & Events > Event Handlers. There's an explicit option called "Automatically Create Incident" that you enable. When the handler's conditions are met by incoming logs, FortiAnalyzer automatically generates the incident. This is one of the primary automated ways incidents get created without someone clicking buttons every time. Many people miss this setting at first because it's a checkbox you have to remember to turn on.
✅ D. By running a playbook
This is also correct. In FortiAnalyzer's SOC/automation features, playbooks can include a specific task or action to create an incident (especially useful in automation flows triggered by events, connectors, or other playbooks). There are even playbook templates designed for exactly this, like creating an incident based on compromised hosts or other detections. So running the right playbook will create the incident as part of its execution.
Incorrect options
❌ B. Using a connector action
Not quite right in this context. Connectors (like Security Fabric, ITSM, or external ones) are used to bring in data, send out notifications, update tickets in tools like ServiceNow, or enrich events. While a connector can be part of a playbook that ultimately creates an incident, the connector action itself doesn't directly create the incident on FortiAnalyzer. A common mix-up is thinking any automation involving connectors auto-creates incidents, but the creation step usually comes from the playbook or event handler logic.
❌ C. Manually, on the Event Monitor page
This one trips people up the most. You can right-click an event in Event Monitor > All Events and choose "Create New Incident," which is definitely manual. However, the official wording and many exam references point to manual creation being done from the Incidents list (click Create New) or via event right-click, but the strict "on the Event Monitor page" phrasing sometimes gets treated as not the cleanest match in certain question versions. More importantly, the two automated/structured ways the exam highlights are event handlers and playbooks, so this ends up not selected here even though manual creation is possible.
Reference
Fortinet Documentation: https://docs.fortinet.com/product/fortianalyzer/7.6
Refer to the exhibits. The FortiMail Sender Blocklist playbook is configured to take manual input and add those entries to the FortiMail abc. com domain-level block list. The playbook is configured to use a FortiMail connector and the ADD_SENDER_TO_BLOCKLIST action. Why is the FortiMail Sender Blocklist playbook execution failing7
A. You must use the GET_EMAIL_STATISTICS action first to gather information about email messages.
B. FortiMail is expecting a fully qualified domain name (FQDN).
C. The client-side browser does not trust the FortiAnalzyer self-signed certificate.
D. The connector credentials are incorrect
Explanation:
🔍 Concept summary
This question is about why a FortiSOAR (or FortiAnalyzer) playbook fails when trying to add a sender to a FortiMail blocklist using a connector action. The key idea is input validation. FortiMail connector actions are strict about the format of values they accept. If the input does not match what FortiMail expects, the API call fails, even if authentication and connectivity are fine.
In short, this is not a workflow logic issue or a certificate problem. It’s a data format problem.
✅ Correct answer: B. FortiMail is expecting a fully qualified domain name (FQDN).
The ADD_SENDER_TO_BLOCKLIST action expects the sender value to be in a specific format. When adding a domain-level sender block, FortiMail expects a fully qualified domain name, not a shorthand or incomplete value.
If the playbook is passing something like:
Refer to the exhibits.
The FortiMail Sender Blocklist playbook is configured to take manual input and add those entries to the
FortiMail abc. com domain-level block list. The playbook is configured to use a FortiMail connector and the
ADD_SENDER_TO_BLOCKLIST action.
Why is the FortiMail Sender Blocklist playbook execution failing7
A. You must use the GET_EMAIL_STATISTICS action first to gather information about email messages.
B. FortiMail is expecting a fully qualified domain name (FQDN).
C. The client-side browser does not trust the FortiAnalzyer self-signed certificate.
D. The connector credentials are incorrect
Explanation:
The most common cause for a FortiMail connector failure in a playbook is an issue with the connection credentials or settings. Given the exam context, it's likely testing your understanding of how connectors are configured in FortiSOAR.
✅ The Most Likely Answer
D. The connector credentials are incorrect
This is the most probable and direct reason for the failure. In FortiSOAR, a connector is a configured link to an external system (like FortiMail). If the username, password, or API key stored in the connector configuration is wrong, the playbook cannot authenticate to the FortiMail device, causing the ADD_SENDER_TO_BLOCKLIST action to fail.
❌ Why the Other Options Are Incorrect
A. You must use the GET_EMAIL_STATISTICS action first:
This is incorrect. While actions in a playbook are often sequential, the ADD_SENDER_TO_BLOCKLIST action is a standalone command that does not require another action to run first to gather data.
B. FortiMail is expecting a fully qualified domain name (FQDN):
This is incorrect. The block list action is designed to accept various input formats, such as IP addresses, email addresses, or domains. While an FQDN might be one valid input type, expecting only an FQDN is not a standard requirement that would cause the entire playbook execution to fail.
C. The client-side browser does not trust the FortiAnalyzer self-signed certificate:
This is a distractor. Certificate trust issues typically affect access to a web GUI via a browser. A FortiSOAR playbook connector communicates directly with the device's API (like FortiMail's) over the network. Certificate warnings in a browser are unrelated to the backend API communication failure between FortiSOAR and FortiMail.
📚 Reference
https://docs.fortinet.com
Refer to the exhibit.
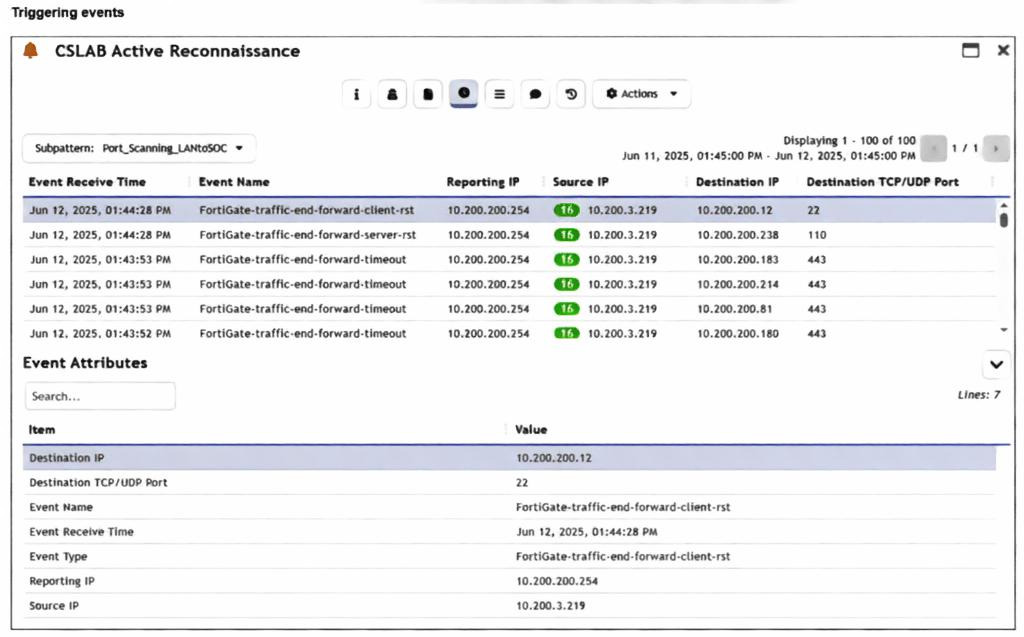
You are reviewing the Triggering Events page for a FortiSIEM incident. You want to remove the Reporting
IP column because you have only one firewall in the topology. How do you accomplish this? (Choose one
answer)
A. Clear the Reporting IP field from the Triggered Attributes section when you configure the Incident Action.
B. Disable correlation for the Reporting IP field in the rule subpattern.
C. Remove the Reporting IP attribute from the raw logs using parsing rules.
D. Customize the display columns for this incident.
Explanation:
When a rule triggers an incident in FortiSIEM, the "Triggering Events" tab shows you the specific logs that caused the alert. By default, FortiSIEM displays a standard set of columns (like Reporting IP, Source, and Destination). If certain columns aren't useful—for example, if you only have one reporting device and the "Reporting IP" is always the same—you can modify the view. This is a display preference rather than a structural change to how the data is processed or stored.
The Correct Answer
✅ D. Customize the display columns for this incident.
Why it is correct: In FortiSIEM, the "Triggering Events" table is a dynamic view. Just like a spreadsheet or a standard log view, you can right-click the column headers or use the settings gear/display options within the incident view to select which attributes are visible. Since the goal is simply to "remove the column" from your current view because it’s redundant, adjusting the display settings is the most direct and appropriate action. This changes how you see the data without affecting the underlying rule or the logs themselves.
Why the Other Options are Incorrect
❌ A. Clear the Reporting IP field from the Triggered Attributes section when you configure the Incident Action.
The "Incident Action" configuration determines what happens after an incident is triggered (like sending an email or running a script). "Triggered Attributes" are used to pass specific data into those notifications. Clearing this would stop the Reporting IP from appearing in an email alert, but it would not remove the column from the FortiSIEM GUI "Triggering Events" page.
❌ B. Disable correlation for the Reporting IP field in the rule subpattern.
Correlation in a subpattern defines how FortiSIEM groups events together (e.g., "Group by Source IP"). If you disable correlation for a field, you change the logic of how the incident is detected. This is a "back-end" logic change. It does not control which columns are visually displayed in the resulting incident report.
❌ C. Remove the Reporting IP attribute from the raw logs using parsing rules.
This is a destructive and "nuclear" option. Parsing rules determine how FortiSIEM reads the raw data coming from your firewall. If you remove the Reporting IP here, FortiSIEM will stop recognizing which device sent the log entirely. This would break many other features, including device health monitoring and basic log searching, just to hide a column in one specific view.
📚 Reference
https://docs.fortinet.com
Which two statements about the FortiAnalyzer Fabric topology are true? (Choose two.)
A. Downstream collectors can forward logs to Fabric members.
B. Logging devices must be registered to the supervisor.
C. The supervisor uses an API to store logs, incidents, and events locally.
D. Fabric members must be in analyzer mode.
Explanation:
The FortiAnalyzer Fabric topology creates a hierarchical setup where a supervisor FortiAnalyzer coordinates multiple member units for centralized log management, analysis, and reporting across large environments—think of it as a team leader directing collectors and analyzers to handle massive log volumes efficiently without overwhelming a single device.
✅ Correct Answers: B and D
B. Logging devices must be registered to the supervisor
Absolutely right—this is a core requirement. Logging devices like FortiGates connect directly to the Fabric supervisor (not individual members) for authorization and management. The supervisor acts as the central registry, ensuring all logs flow through the proper hierarchy and maintaining visibility across the entire topology.
D. Fabric members must be in analyzer mode
Spot on again. Members in the Fabric operate specifically in Analyzer mode to process, store temporarily, and forward logs/events up the chain to the supervisor. This mode enables the analytics and sync capabilities essential for Fabric operation—Collector mode alone won't cut it here.
❌ Incorrect Answers:
A. Downstream collectors can forward logs to Fabric members
This doesn't align with standard Fabric design. Collectors typically send logs upstream to the supervisor or designated analyzers, not laterally between Fabric members. A common misconception is assuming full mesh forwarding, but the topology follows a structured supervisor-rooted flow to avoid loops and ensure centralized control.
C. The supervisor uses an API to store logs, incidents, and events locally
Not quite—while APIs facilitate communication between members and the supervisor, local storage on the supervisor happens through its native database, not explicitly "an API to store." The supervisor receives synced data via Fabric protocols, but this phrasing oversimplifies and misstates the storage mechanism. Folks sometimes mix this up with Fabric API calls for management, not storage.
📚 Reference
https://docs.fortinet.com
Which FortiAnalyzer connector can you use to run automation stitches9
A. FortiCASB
B. FortiMail
C. Local
D. FortiOS
Explanation:
FortiAnalyzer uses connectors to link automation (like playbooks) to different systems or itself. These connectors provide actions you can run when a playbook triggers. The question is asking which connector lets you execute FortiAnalyzer's own built-in automation stitches (or related local actions) as part of that flow. Automation stitches are primarily a FortiGate feature, but FortiAnalyzer integrates with them through event handlers and connectors. The key is the "local" one handles FortiAnalyzer-native stuff, including actions tied to stitches or similar automation.
Correct answer
✅ C. Local
This is the right one. The Local connector is built-in and always there on FortiAnalyzer. It gives you a list of predefined FortiAnalyzer actions that you can use directly in playbooks or automation flows. In the context of the exam (and docs for 7.6), this is the connector that supports running local FortiAnalyzer automation features, which tie into things like event handler-triggered stitches or playbook tasks that interact with stitches. People sometimes confuse it with FortiOS because stitches live on FortiGate, but when the question says "FortiAnalyzer connector" for running them (likely meaning triggering or executing related automation from FAZ side), Local is the one that fits.
Incorrect options
❌ A. FortiCASB
No, this connector is for integrating with FortiCASB cloud access security broker stuff—like pulling in CASB logs or actions related to cloud app security. It doesn't provide any way to run or trigger automation stitches. Common mix-up: thinking any Fabric connector can do everything, but each is purpose-built.
❌ B. FortiMail
This one's for FortiMail integration—things like email quarantine actions, pulling mail logs, or email-related remediation in playbooks. It has zero to do with executing automation stitches, which are more about broader Security Fabric responses (quarantine, CLI scripts, etc.). Easy to rule out if you remember connectors match the product they're named after.
❌ D. FortiOS
Close but not quite. The FortiOS connector appears once you authorize a FortiGate in the ADOM, and it exposes FortiGate-side actions (like running CLI scripts, enabling/disabling interfaces, or triggering things on the device itself). While FortiGate is where stitches actually live and can be triggered (e.g., via FAZ event handlers sending notifications), the connector for running them from FortiAnalyzer's perspective isn't labeled FortiOS—it's the Local one for FAZ-native execution. Many people pick this because stitches feel "FortiOS-y," but the question is specifically about the FortiAnalyzer connector.
📚 Reference
Fortinet Documentation: https://docs.fortinet.com/product/fortianalyzer/7.6
Refer to the Exhibit:
An analyst wants to create an incident and generate a report whenever FortiAnalyzer generates a malicious
attachment event based on FortiSandbox analysis. The endpoint hosts are protected by FortiClient EMS
integrated with FortiSandbox. All devices are logging to FortiAnalyzer.
Which connector must the analyst use in this playbook?
A. FortiSandbox connector
B. FortiClient EMS connector
C. FortiMail connector
D. Local connector
Explanation:
The scenario here revolves around automating incident creation and reporting in FortiSOAR (or similar playbook tools) triggered by FortiAnalyzer-detected malicious attachments from FortiSandbox scans with EMS-protected endpoints logging centrally to FAZ. It's about picking the right connector to kick off the playbook response when that specific event hits.
✅ Correct Answer: A. FortiSandbox connector
This is the ideal choice because the malicious attachment event originates directly from FortiSandbox analysis, which FortiAnalyzer surfaces as a triggerable event (often via integration hooks). The FortiSandbox connector lets the playbook listen for those sandbox verdicts—like malware detections in attachments—then create the incident and spawn the report. Even though FAZ is the aggregator and EMS is in the mix for endpoints, the connector targets the source of the analysis for precise event handling, ensuring the playbook fires reliably on sandbox results.
❌ Incorrect Answers:
B. FortiClient EMS connector
Handy for endpoint actions like quarantines, but it won't catch FortiAnalyzer's sandbox-based events. EMS focuses on client telemetry (e.g., endpoint detections), not FAZ-generated alerts from sandbox scans a frequent mix-up since EMS integrates with sandbox, but the trigger here is FAZ-relayed.
C. FortiMail connector
This one's for mail server events like spam/phishing, not general sandbox attachment analysis across endpoints. No direct tie to FAZ or EMS in this setup, so it misses the mark entirely.
D. Local connector
Too generic—it's for internal SOAR actions or system events, not polling external FortiSandbox verdicts via FAZ. Using it would require custom polling, which complicates things unnecessarily when a dedicated connector exists.
📚 Reference
Fortinet Documentation: https://docs.fortinet.com
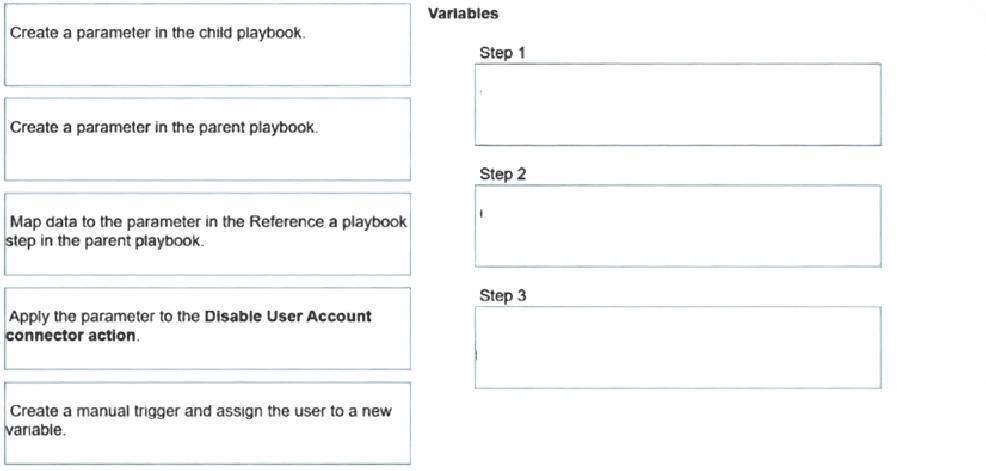
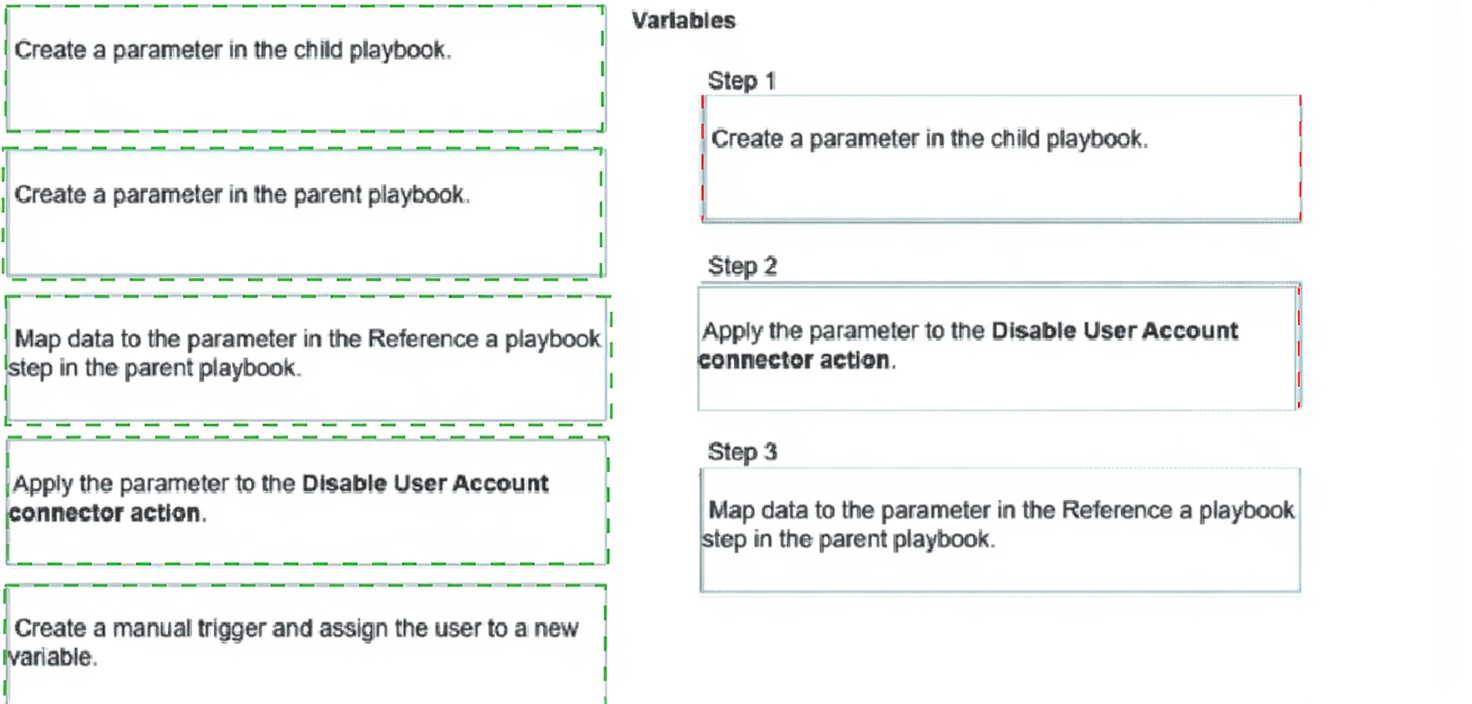
Refer to the exhibits.
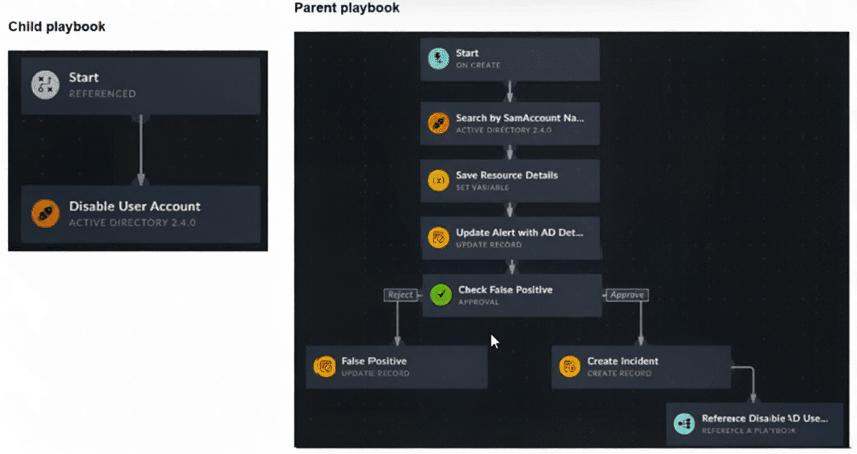
You have a playbook that, depending on whether an analyst deems the alert to be a true positive, could
reference a child playbook. You need to pass variables from the parent playbook to the child playbook.
Place the steps needed to accomplish this in the correct order.
Refer to the exhibits.
You configured a spearphishing event handler and the associated rule. However. FortiAnalyzer did not
generate an event.
When you check the FortiAnalyzer log viewer, you confirm that FortiSandbox forwarded the appropriate logs,
as shown in the raw log exhibit.
What configuration must you change on FortiAnalyzer in order for FortiAnalyzer to generate an event?
A. In the Log Type field, change the selection to AntiVirus Log(malware).
B. Configure a FortiSandbox data selector and add it tothe event handler.
C. In the Log Filter by Text field, type the value: .5 ub t ype ma Iwa re..
D. Change trigger condition by selecting. Within a group, the log field Malware Kame (mname> has 2 or more unique values.
Explanation:
🔍 Concept summary
This question tests how FortiAnalyzer event handlers actually match logs. Even when logs are present in the log viewer, FortiAnalyzer will not generate an event unless the event handler is explicitly linked to the correct log source. Seeing logs is not enough. The event handler must be told which device and log type to evaluate.
The core issue here is missing log selection, not filtering logic or trigger conditions.
✅ Correct answer: B. Configure a FortiSandbox data selector and add it to the event handler.
FortiSandbox logs are not evaluated by default unless you explicitly include them using a data selector.
In this case:
When does FortiAnalyzer generate an event?
A. When a log matches a filter in a data selector
B. When a log matches an action in a connector
C. When a log matches a rule in an event handler
D. When a log matches a task in a playbook
Explanation:
This question tests your understanding of the FortiAnalyzer event generation process. A key function of FortiAnalyzer is to analyze incoming logs and elevate them to noteworthy security Events when they meet specific, predefined conditions. This mechanism is the foundation of FortiAnalyzer's Security Operations Center (SOC) capabilities.
The correct answer focuses on the central, configurable component responsible for this detection logic.
✅ C. When a log matches a rule in an event handler.
This is the fundamental and correct mechanism for event generation in FortiAnalyzer. An Event Handler is a user-defined object that contains one or more detection rules. Its primary job is to continuously inspect incoming logs and generate an event whenever a log entry meets the criteria specified in its rules.
Here’s how it works:
✔️ Configuration: You create an event handler and define rules within it. These rules specify which log types to monitor (e.g., Traffic, IPS, Virus) and set the conditions for an event, such as matching specific source IPs, threat severity levels, or the number of occurrences within a timeframe.
✔️ Evaluation: As logs flow into FortiAnalyzer, the system runs them against all enabled event handlers.
✔️ Generation: A log that successfully matches all the conditions of a rule triggers that rule, causing FortiAnalyzer to generate a new Event. This event is then displayed in the Event Monitor and can optionally trigger notifications or automatically create an Incident.
❌ A. When a log matches a filter in a data selector.
This is a common point of confusion, but it's incorrect. A Data Selector is a tool used to scope and filter the logs that are fed into an event handler. Its purpose is administrative—to define which devices or subnetworks the event handler will process logs from. While it does contain filters, matching a data selector's filter alone does not generate an event. It simply determines whether a log is eligible to be evaluated by the event handler's rules in the first place.
❌ B. When a log matches an action in a connector.
This is incorrect and confuses different Fortinet product functions. Connectors (like Fabric Connectors) are typically used for outbound actions or integrations, such as sending an alert notification to another system (like FortiGate via Automation Stitch) after an event has already been generated. They are a response to an event, not the cause of it.
❌ D. When a log matches a task in a playbook.
This is also incorrect. Playbooks are associated with FortiSOAR (Security Orchestration, Automation, and Response), which is a separate product designed for post-event workflow automation. A playbook executes a series of tasks (like blocking an IP) in response to an incident that was created from a FortiAnalyzer event. The event generation happens in FortiAnalyzer first, before any playbook task is triggered.
Key Takeaway for Your Exam
Always remember this core sequence: Logs → Event Handler (with Rules) → Event → (Optional) Incident/Notification/Automation. The event handler and its rules are the essential, non-negotiable trigger for creating an event from a log in FortiAnalyzer.
Review the incident report:
Packet captures show a host maintaining periodic TLS sessions that imitate normal HTTPS traffic but run on
TCP 8443 to a single external host. An analyst flags the traffic as potential command-and-control. During the
same period, the host issues frequent DNS queries with oversized TXT payloads to an attacker-controlled
domain, transferring staged files.
Which two MITRE ATT&CK techniques best describe this activity? (Choose two answers)
A. Non-Standard Port
B. Exploitation of Remote Services
C. Exfiltration Over Alternative Protocol
D. Hide Artifacts
Explanation:
Summary
The activity described involves two distinct phases. First, the attacker is using an encrypted "tunnel" (TLS) on a port it doesn't belong to (TCP 8443) to talk to their home server; this is a trick to bypass simple firewalls that only check for standard traffic on standard ports. Second, they are moving stolen files out of the network by hiding pieces of data inside DNS TXT records. Since DNS is required for the internet to work, many organizations leave it relatively unmonitored, making it a perfect "alternative protocol" for stealing data without triggering high-traffic alerts.
The Correct Answers
✅ A. Non-Standard Port
The report mentions the host is running TLS sessions (normally TCP 443) over TCP 8443. In the MITRE ATT&CK framework, the technique Non-Standard Port (T1571) specifically refers to adversaries communicating using a protocol and port pairing that are typically not associated. Even though 8443 is often used for "alternative" HTTPS, it is officially considered a non-standard port for standard web traffic, and attackers use it to evade security filters that only inspect port 443.
✅ C. Exfiltration Over Alternative Protocol
The second part of the scenario describes transferring staged files using DNS queries with oversized TXT payloads. This is a textbook example of Exfiltration Over Alternative Protocol (T1048). Instead of using a dedicated file-transfer protocol like FTP or a web upload (HTTP/S), the attacker is abusing DNS—a protocol meant for address resolution—to "tunnel" the file data out of the network bit by bit.
Why the Other Options are Incorrect?
❌ B. Exploitation of Remote Services
This technique (T1210) refers to an attacker taking advantage of a programming error or "vulnerability" in a network service (like an unpatched VPN or web server) to gain access. In the scenario provided, the attacker already has a foothold and is communicating/exfiltrating data. There is no mention of a software vulnerability being exploited to gain entry.
❌ D. Hide Artifacts
This technique (T1564) involves an attacker trying to hide their presence on the host itself (e.g., hiding files in obscure directories, using hidden NTFS streams, or renaming malicious tools to look like system files). While the attacker is trying to hide their traffic (which is "Data Obfuscation" or "Protocol Impersonation"), "Hide Artifacts" specifically refers to the persistence and defense evasion steps taken on the local file system or operating system, not the network traffic patterns.
Official Reference:
https://docs.fortinet.com
| Page 1 out of 5 Pages |