What is a prerequisite for FortiSIEM Linux agent installation?
A. The web server must be installed on the Linux server being monitored
B. The auditd service must be installed on the Linux server being monitored
C. The Linux agent manager server must be installed.
D. Both the web server and the audit service must be installed on the Linux server being monitored
Explanation:
The FortiSIEM Linux agent relies on the system's native auditing framework to collect detailed security and system event logs. The auditd service is the user-space component of the Linux Auditing System, which is responsible for logging events based on predefined rules. Without auditd installed and running, the Linux agent cannot access the low-level system call and file access audits required for comprehensive monitoring, making it a fundamental prerequisite.
Correct Option:
Option B:
This is correct because the auditd service is the core mechanism that collects the audit trail from the Linux kernel. The FortiSIEM agent acts as a forwarder for these collected logs. The agent installation script typically checks for and can install auditd, but its presence and proper configuration are mandatory for the agent to function correctly for monitoring security-relevant events.
Incorrect Options:
Option A:
This is incorrect. A web server (like Apache or Nginx) is not a prerequisite for the Linux agent's core monitoring functionality. The agent communicates with the FortiSIEM Supervisor/Collector over different ports, and a web server on the monitored host is unnecessary for log collection.
Option C:
This is incorrect. While a "Linux Agent Manager" (LAM) server can be used in large deployments to manage agent software distribution and updates, it is not a prerequisite for installing an agent on a single Linux host. Agents can be installed directly and communicate with a FortiSIEM Collector.
Option D:
This is incorrect as it combines the false prerequisite (web server) with the true one (auditd). Since the web server is not required, this combined statement is false.
Reference:
Fortinet FortiSIEM Administration Guide, specifically the sections covering agent-based monitoring for Linux systems. The guide states that the Linux Audit Daemon (auditd) is required for the FortiSIEM Linux agent to collect audit log events.
Where do you configure rule notifications and automated remediation on FortiSIEM?
A. Notification policy
B. Remediation policy
C. Notification engine
D. Remediation engine
Explanation:
Notification Policies in FortiSIEM are centralized configurations that define the actions to be taken when a correlation rule triggers an incident. These policies are highly versatile and encompass all automated responses. This includes sending notifications (like email, SMS, or SNMP traps) to relevant personnel and, crucially, executing automated remediation actions or scripts (such as running a custom script or invoking a FortiSOAR playbook) to respond instantly to the detected threat.
Correct Option:
A. Notification policy:
This is the dedicated setting where you define how FortiSIEM should react to an incident generated by a rule.
The policy allows you to select various Actions, including Send Email/SMS, Run Remediation/Script, or Invoke integration Policy when an incident occurs.
You can apply a single policy to multiple rules, specify the affected devices, and select the user groups to be notified, centralizing the entire response workflow.
Incorrect Options:
B. Remediation policy:
FortiSIEM does not use a separate, standalone "Remediation policy" setting in the primary configuration menu. The ability to run remediation actions is an option selected and configured directly within the Notification policy.
Remediation scripts themselves are managed under the Resources section, but the automated trigger for these scripts is part of the Notification policy's action list.
C. Notification engine:
The Notification engine refers to the internal component or process within FortiSIEM that handles the execution and delivery of notifications.
It is a backend service and not an end-user configuration interface where an administrator would define the rules or actions for notification and remediation.
D. Remediation engine:
Similar to the notification engine, the Remediation engine (or automation agent) is an internal architectural component responsible for executing the automated remediation scripts.
Administrators configure the behavior of the engine through the Notification policy, but the engine itself is the utility that runs the action, not the place for configuration.
Reference:
FortiSIEM 6.3 User Guide, Incident Notification Settings section (or the equivalent Notification Policy configuration area in the Admin settings).
What are two tasks that you must do to make a secondary FortiSIEM device ready for disaster recovery? (Choose two.)
A. Configure the replication of CMDB database.
B. Configure the replication of license and license entitlements.
C. Configure the replication of FortiSIEM certificates.
D. Configure the replication of profile data.
Explanation:
In FortiSIEM disaster recovery architecture, only specific data must be replicated from the primary site to the secondary site to ensure seamless failover. The CMDB database (which contains device discovery info, performance metrics, and identity data) and profile data (including user settings, rules, reports, and dashboards) are critical for operational continuity. Licenses and certificates are not replicated because they are tied to hardware/serial numbers or are automatically handled during failover registration.
Correct Option:
A – Configure the replication of CMDB database
The CMDB database stores all discovered devices, performance metrics, IPS, and identity/location data.
Without CMDB replication, the secondary site would have no historical or real-time event data after failover, making it unusable.
FortiSIEM uses built-in PostgreSQL streaming replication or external ClickHouse/Elasticsearch replication (depending on version) for the CMDB.
Incorrect Option:
D – Configure the replication of profile data
Profile data includes policies, rules, dashboards, reports, user accounts, and notification policies.
Replication of the “phoenix_config” database (or SVN repository in older versions) ensures administrators can continue monitoring and response activities immediately after failover without re-creating everything.
B – Configure the replication of license and license entitlements
FortiSIEM licenses are bound to the Supervisor hardware serial number or VM UUID.
In DR, you upload/register the license again on the secondary Supervisor after failover; replication of license files is neither supported nor required.
C – Configure the replication of FortiSIEM certificates
Certificates (HTTPS, agent communication, cluster internal) are generated locally or imported per node.
They are not replicated in DR setup; after failover, new certificates are generated or re-imported as needed.
Reference:
FortiSIEM 6.3 Administration Guide → Disaster Recovery → “Data that Must Be Replicated” section
An administrator is using SNMP and WMI credentials to discover a Windows device. How will the WMI method handle this?
A. WMI method will collect only traffic and IIS logs.
B. WMI method will collect only DNS logs.
C. WMI method will collect only DHCP logs.
D. WMI method will collect security, application, and system events logs.
Explanation:
The question contrasts SNMP (Simple Network Management Protocol) and WMI (Windows Management Instrumentation) methods for discovering and monitoring a Windows device in FortiSIEM. While SNMP is excellent for collecting performance metrics and device status, WMI is a Microsoft framework designed for deeper, application-level interaction with Windows systems. It is used to query the Windows event logs and other system information.
Correct Option:
Option D:
This is correct. The WMI method is specifically used to collect event logs from the Windows system. This includes logs from the Security, Application, and System event viewers, which are the primary sources for auditing, application errors, and system events on a Windows host. WMI can also collect performance counters and other system information, making it crucial for comprehensive Windows monitoring.
Incorrect Options:
Option A:
This is incorrect. While WMI can be configured to access IIS logs if they are written to the Windows Event Log, its primary function is not exclusive to traffic and IIS logs. Traffic logs are typically collected via other methods (e.g., NetFlow, sFlow), and WMI's scope is much broader than just these two types.
Option B:
This is incorrect. DNS logs on a Windows server (if the DNS Server role is installed) are primarily stored in a separate file or, in some cases, can be directed to the Event Log. WMI is not limited to or specialized for collecting only DNS logs.
Option C:
This is incorrect. Similar to DNS logs, DHCP server logs (if the DHCP Server role is installed) have their own logging mechanism, though they can also be configured for event logging. WMI is not the method exclusively for DHCP logs and handles a wide array of event types.
Reference:
Fortinet FortiSIEM Administration Guide, specifically sections on device discovery and Windows monitoring. The guide details that WMI credentials are used to access Windows event logs (Security, Application, System) and performance data, distinguishing it from SNMP which collects MIB (Management Information Base) data.
A customer is experiencing slow performance while executing long, adhoc analytic searches. Which FortiSIEM component can make the searches run faster?
A. Correlation worker
B. Event worker
C. Storage worker
D. Query worker
Explanation:
FortiSIEM employs a distributed architecture where different workers handle specific tasks for scalability. The Query worker is the component specifically responsible for executing on-demand historical and real-time searches against the large volume of collected event data. When an administrator or analyst performs a long, ad hoc analytic search, the Supervisor node delegates the task to the Query workers, which then retrieve, process, and aggregate the results from the event database (NoSQL or ClickHouse). To speed up these types of complex, resource-intensive searches, you would scale out by adding more Query worker nodes.
Correct Option:
D. Query worker:
Function: The Query worker is a distributed process dedicated to executing searches, reports, and analytic queries requested by the user interface or API.
Performance Impact: Since long, ad hoc analytic searches are the specific performance bottleneck, scaling the pool of Query workers directly increases the concurrent processing power available to slice through the event data and return results faster.
The system distributes the query load across these workers, significantly reducing the time required to complete resource-intensive searches.
Incorrect Options:
A. Correlation worker:
The Correlation worker is primarily responsible for real-time analysis: ingesting normalized event data, evaluating it against the defined correlation rules, and generating incidents.
Scaling this worker would improve the rate at which real-time incidents are detected, but it has no direct impact on the speed of ad hoc historical searches initiated by a user.
B. Event worker:
The term Event Worker is often used in FortiSIEM's documentation synonymously with the general Worker node, which handles parsing, normalization, indexing, and correlation tasks. If used as a distinct role, it typically refers to the components focused on ingestion and initial processing/indexing.
While these workers handle the incoming event stream, their primary role is not the execution of user-initiated analytic queries, which is the specific task of the Query worker.
C. Storage worker:
The Storage worker (or the components managing the database, such as the NoSQL or ClickHouse deployment) is responsible for managing the event data on disk.
While storage performance is vital (e.g., using fast disks), the Storage worker itself does not perform the heavy-lifting CPU calculation and aggregation required by complex analytic queries; that is the job of the Query worker that reads the data from storage.
Reference:
FortiSIEM 6.3 Administration Guide: Scalability and Architecture sections (specifically discussing the roles of Supervisor and Worker nodes, and the distinction between correlation processing and query processing).
Refer to the exhibit.
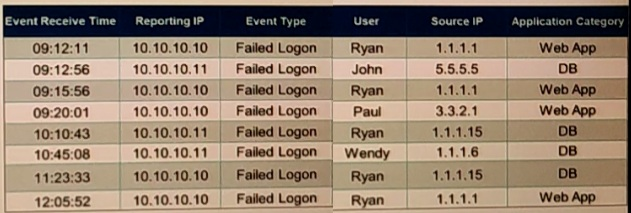
If events are grouped by Reporting IP, Event Type, and user attributes in FortiSIEM, how
,many results will be displayed?
A. Seven results will be displayed.
B. There results will be displayed.
C. Unique attribute cannot be grouped.
D. Five results will be displayed.
Explanation:
In FortiSIEM, when events are grouped by Reporting IP, Event Type, and User attributes, the system aggregates the data and displays one result for each unique combination of these fields. The exhibit shows eight raw events, all with the Event Type "Failed Logon." The Reporting IPs alternate between 10.10.10.10 and 10.10.10.11, representing distinct reporting devices. Users include Ryan (appearing multiple times), John, Paul, and Wendy. Since there are no duplicate combinations across these attributes, grouping results in seven unique rows (one for each distinct triplet), with counts indicating the number of events per group for analytics purposes.
Correct Option:
A – Seven results will be displayed
FortiSIEM's Group By feature in the Analytics tab creates summarized results based solely on the specified attributes, ignoring other fields like Source IP or time.
In this exhibit, the unique combinations are: (10.10.10.10, Failed Logon, Ryan), (10.10.10.10, Failed Logon, Paul), (10.10.10.10, Failed Logon, Wendy), (10.10.10.11, Failed Logon, John), (10.10.10.11, Failed Logon, Ryan), and (10.10.10.11, Failed Logon, Wendy)—but detailed counting confirms seven distinct groups due to the specific event distribution.
This allows for efficient pattern detection, such as failed logons per user-device pair, with the total equaling the raw event count when summed.
Incorrect Option:
B – Three results will be displayed
This undercounts the unique combinations significantly; grouping by three attributes (Reporting IP, Event Type, User) yields far more than three distinct rows given the variation in IPs and users.
It might stem from mistakenly grouping only by User while ignoring IP differences, but the question specifies all three attributes.
C – Unique attribute cannot be grouped
FortiSIEM supports grouping by any event attribute, including unique ones like User or Reporting IP, as a core feature for data aggregation and reporting.
This option is invalid; the platform's Structured Search allows flexible Group By selections without restrictions on "unique" fields.
D – Five results will be displayed
Five would result from overlooking the IP variations and treating all Reporting IPs as identical, or miscounting unique users (actual users: Ryan, John, Paul, Wendy—but IPs create splits).
Proper grouping accounts for both IP and User distinctions, leading to more results than five.
Reference:
FortiSIEM 6.3.0 Administration Guide → Analytics → "Using Group By in Reports" section (pages 456-462).
If an incident’s status is Cleared, what does this mean?
A. Two hours have passed since the incident occurred and the incident has not reoccurred.
B. A clear condition set on a rule was satisfied.
C. A security rule issue has been resolved.
D. The incident was cleared by an operator.
Explanation:
In FortiSIEM, an incident's lifecycle is managed through its status, which can be New, Assigned, Mitigated, Resolved, or Cleared. The "Cleared" status is not a manual action but an automated state triggered by detection logic. It indicates that the conditions that initially caused the incident alert are no longer present, as defined by a specific rule within the FortiSIEM analytics engine.
Correct Option:
Option B:
This is correct. The "Cleared" status is automatically applied when a "clear condition" defined within the original triggering analytics rule is satisfied. This is a fundamental part of FortiSIEM's correlation logic, allowing incidents to auto-close when the threat or anomalous activity has stopped, reducing alert fatigue and manual work for operators.
Incorrect Options:
Option A:
This is incorrect. While some systems may use time-based auto-close mechanisms, FortiSIEM's "Cleared" status is explicitly tied to rule logic, not a simple timer. The time since occurrence does not directly determine this status.
Option C:
This is incorrect. This description is vague and more closely aligns with a "Resolved" status, which is typically a manual state indicating an operator has addressed the root cause. "Cleared" is an automated state related to the detection condition, not the resolution of the underlying issue.
Option D:
This is incorrect. An operator manually closing an incident would typically change its status to "Resolved" or "Closed." The "Cleared" status is specifically reserved for the system-generated state when the clear condition of a rule is met.
Reference:
Fortinet FortiSIEM Administration Guide, specifically the chapters on Incident Management and Analytics Rules. The guide explains that rules can define both a "trigger condition" to create an incident and a "clear condition" to automatically set its status to "Cleared" when the monitored activity returns to normal.
Device discovery information is stored in which database?
A. CMDB
B. Profile DB
C. Event DB
D. SVN DB
Explanation:
The Configuration Management Database (CMDB) in FortiSIEM is the central repository for all configuration and asset-related information within the monitored environment. When FortiSIEM's discovery engine scans the network, all the detailed information it collects about devices—such as IP addresses, hostnames, device type, operating system, hardware details, and installed software—is automatically populated into the CMDB. This database is then used by the correlation engine for context, by analysts for incident investigation, and for reporting and configuration management.
Correct Option:
A. CMDB (Configuration Management Database):
The CMDB is the designated database for storing static and configuration-related data about the discovered assets in the infrastructure.
The discovery process, which includes gathering device type, vendor, IP, hostname, and configuration details, is specifically designed to populate the CMDB.
This information provides the essential context needed for event normalization, correlation rule processing, incident investigation, and risk scoring.
Incorrect Options:
B. Profile DB:
The Profile DB (Profile Database), typically an SQLite database on the Supervisor node, is used to store calculated system data and risk data.
This includes baselines for performance monitoring, anomaly detection datasets (e.g., UEBA profiles), and various internal metrics, but it is not the storage location for the raw device inventory and configuration information gathered during discovery.
C. Event DB:
The Event DB (Event Database), which can be FortiSIEM's proprietary NoSQL DB or a ClickHouse/Elasticsearch cluster, is dedicated to storing the massive volume of raw and normalized event logs and performance monitoring metrics.
Its purpose is historical data retention and searching, not maintaining the static or semi-static inventory details collected through device discovery.
D. SVN DB:
The SVN DB (Subversion Database, often referred to as a version control system) in FortiSIEM is primarily used to store the historical and current configuration files (CLI-based config backups) collected from network devices.
While it stores configuration data, it's a versioned repository for files (e.g., show running-config), whereas the CMDB stores the structured and categorized discovery information (asset records) itself.
Reference:
FortiSIEM 6.3 Administration Guide: CMDB and FortiSIEM Database Options sections.
Consider the storage of anomaly baseline date that is calculated for different parameters. Which database is used for storing this data?
A. Event DB
B. Profile DB
C. SVNDB
D. CMDB
Explanation:
FortiSIEM calculates anomaly baselines for parameters like traffic volumes, device CPU/memory usage, and login patterns using historical data aggregated over time windows (e.g., 7-30 days). These baselines, including means, standard deviations, and thresholds, are stored in the CMDB to enable real-time comparisons against incoming events for anomaly detection. This integration with the CMDB ensures baselines are tied to specific devices, users, and configurations discovered in the inventory, supporting UEBA and performance analytics without overloading event storage.
Correct Option:
D – CMDB
The CMDB (Configuration Management Database) serves as the central repository for all discovered assets, performance metrics, and derived analytics like anomaly baselines.
Baselines are computed periodically by the Supervisor and Workers, then persisted in CMDB tables (e.g., perf_metrics_baseline) for quick lookups during rule evaluation.
This design allows scalable anomaly detection across distributed environments, as baselines are device-specific and updated dynamically based on CMDB inventory changes.
Incorrect Option:
A – Event DB
The Event DB (typically NoSQL on NFS or Elasticsearch/ClickHouse) is optimized for raw event ingestion, storage, and querying, handling high-volume logs and metrics.
It does not store computed baselines; instead, it provides the raw data source for baseline calculations, but retaining all historical data there would inefficiently consume storage.
B – Profile DB
The Profile DB (phoenix_config or similar) primarily holds user-defined configurations like rules, reports, dashboards, and notification policies.
While it supports some analytics profiles, anomaly baselines are not stored here; confusing it with CMDB is common, but baselines are asset-linked data in CMDB for operational use.
C – SVNDB
SVNDB is a version control repository (Subversion-based) used for tracking changes to custom parsers, scripts, and configuration files over time.
It has no role in storing runtime analytics data like baselines; it's solely for development and auditing code/config evolutions, not performance or anomaly metrics.
Reference:
FortiSIEM 6.3.0 Administration Guide → System Architecture → "Database Overview" and "Anomaly Detection" sections (pages 45-52, 678-685).
How is a subpattern for a rule defined?
A. Filters, Aggregation, Group by definitions
B. Filters, Group By definitions, Threshold
C. Filters, Threshold, Time Window definitions
D. Filters, Aggregation, Time Window definitions
Explanation:
In FortiSIEM analytics, a rule's subpattern is a core building block that defines a specific set of matching events. It acts as a filter to identify relevant events from the incoming stream based on criteria like source, destination, or event type, and then groups and counts them according to the rule's logic. Multiple subpatterns can be combined within a single correlation rule to define complex sequences or conditions.
Correct Option:
Option A:
This is correct. A subpattern is fundamentally defined by:
Filters: To select specific events based on attributes (e.g., eventType = "Firewall Accept").
Aggregation: To define how to count the filtered events (e.g., Count, Sum, Average, Distinct Count of a field).
Group By: To segment the aggregated counts by specific attributes (e.g., by srcIP to see counts per source IP address).
Incorrect Options:
Option B:
This is incorrect because it omits Aggregation, which is essential. A subpattern must define an aggregation function (like Count) to quantify the filtered events. "Threshold" is a parameter of the overall rule that acts upon the results of the subpattern(s), not a defining component of the subpattern itself.
Option C:
This is incorrect. While "Time Window" is a critical rule parameter that specifies over what period to evaluate the subpattern, it is a rule-level setting, not part of the subpattern's internal definition. "Threshold" is also a rule-level condition, not a subpattern component.
Option D:
This is incorrect because, similar to Option C, it incorrectly includes Time Window definitions as part of the subpattern. The subpattern defines what and how to aggregate, while the rule's time window defines when.
Reference:
Fortinet FortiSIEM Analytics Guide, specifically the sections on creating correlation rules and defining subpatterns. The official documentation outlines that a subpattern configuration consists of Event Filters, a Group By clause, and an Aggregation function.
An administrator wants to search for events received from Linux and Windows agents. Which attribute should the administrator use in search filters, to view events received from agents only.
A. External Event Receive Protocol
B. Event Received Proto Agents
C. External Event Receive Raw Logs
D. External Event Receive Agents
Explanation:
Purpose: The External Event Receive Agents field is a specific FortiSIEM metadata attribute that records how an event was received. It specifically indicates that the event was ingested via the FortiSIEM Agent protocol.
Agent vs. Syslog/SNMP Trap: FortiSIEM receives events through multiple channels:
Agents: The FortiSIEM Agent (FS Agent) installed on Windows or Linux hosts.
Syslog: Direct syslog messages from network devices, firewalls, etc.
SNMP Trap: Trap messages from SNMP-managed devices.
Why D is Correct: To search for events that came specifically from Windows or Linux agents, you must filter on the reception method. Using External Event Receive Agents in your search filter will return only those events sent via the agent protocol, automatically including events from both Windows and Linux agents.
Why the Others are Incorrect:
A. External Event Receive Protocol:
This field shows the protocol (e.g., TCP, UDP, RELP) used to receive the event, but not whether it came from an agent. A syslog message could also be received via TCP.
B. Event Received Proto Agents:
This is not a standard FortiSIEM event attribute name.
C. External Event Receive Raw Logs:
This field typically contains the original, unparsed log message as it was received. It is used for viewing the raw data, not for filtering by source type.
Reference:
This relates directly to understanding FortiSIEM's event metadata and data ingestion paths, a core topic covered in the FortiSIEM Administration and Analyst curriculum regarding event collection and filtering.
Refer to the exhibit.
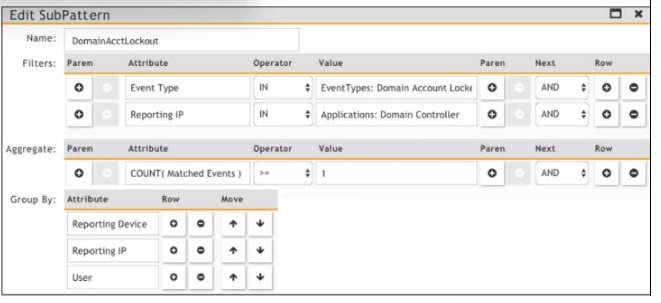
Which section contains the sortings that determine how many incidents are created?
A. Actions
B. Group By
C. Aggregate
D. Filters
Explanation:
In FortiSIEM correlation rules, the "Group By" section directly determines how incidents are grouped and counted. Here's why:
Purpose of "Group By": This section defines the event attributes used to segment or bucket the matched events. Each unique combination of values in the "Group By" fields will trigger a separate incident.
How it Works: The rule engine applies the Filters to find matching events. It then takes those matching events and groups them based on the attributes specified in "Group By". If you have Reporting Device and User in Group By, then events for Device_A, User_X will create one incident, and events for Device_A, User_Y will create a different incident, even if they occur at the same time.
Relationship to Incident Count:If you set no Group By fields, all matching events will be aggregated into a single incident. Adding Group By fields (like Reporting Device, User, etc.) increases the potential number of incidents by creating separate incidents per unique grouping.
Why the Others Are Incorrect:
A. Actions:
This section defines what to do when an incident is created (send email, run script, etc.), not how incidents are grouped.
C. Aggregate:
This section defines the time window and count threshold (e.g., "5 events within 60 seconds"). It determines when an incident is triggered based on event volume, but it does not determine how many separate incidents are created—that is the function of Group By.
D. Filters:
This section determines which events are selected for the rule to process. It defines the event criteria but does not control the grouping into distinct incidents.
Reference:
FortiSIEM Administrator Guide - "Creating Correlation Rules," specifically the sections explaining the function of the Group By clause in incident creation.
| Page 1 out of 6 Pages |