Your client would like to create a new harmonization field - Exam Topic.
The below table represents the harmonization logic from each source.
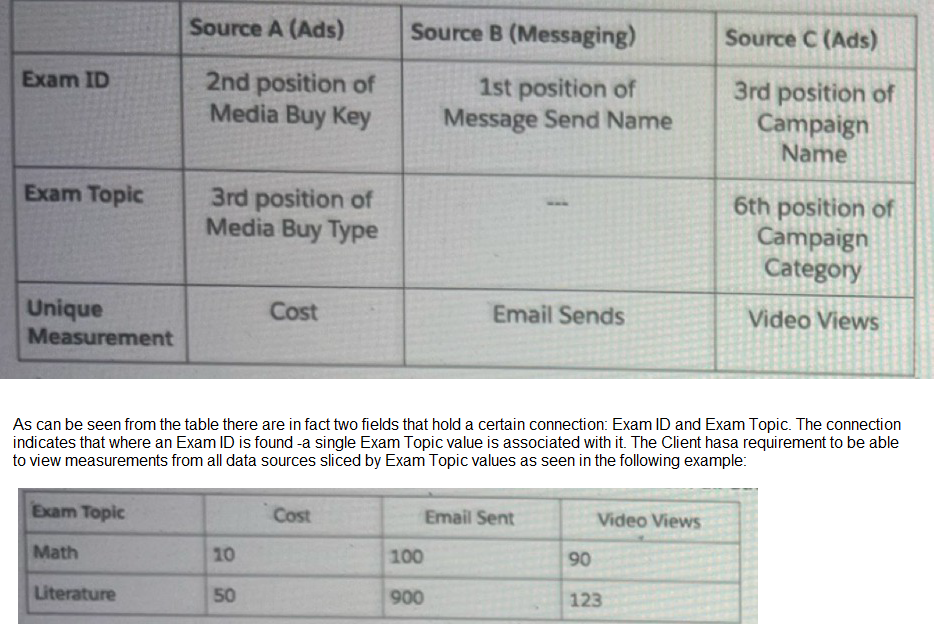
Which harmonization feature should an Implementation engineer use to meet the client's requirement?
A. Transformers
B. Parent Chile
C. Fusion
D. Custom Classification
E. Calculated dimensions
Explanation:
Why D is Correct:
A Custom Classification in Marketing Cloud Intelligence is specifically designed for this purpose. It allows you to map multiple, disparate values from different source fields into a single, unified dimension (a "harmonized field").
In this case, you have three different sources, each with a different field containing values for "Exam Topic":
Source A: 3rd position of Media Buy Type
Source B: (No direct field, implied to be derived from another value)
Source C: 6th position of Campaign Category
You would create a new Custom Classification dimension called "Exam Topic". Within its settings, you define rules to map the values from these three different source fields into the new, common set of values (e.g., "Math", "Literature"). This creates a single dimension that can be used across all widgets to slice the metrics Cost, Email Sends, and Video Views, exactly as shown in the client's desired output table.
Why the Other Options are Incorrect:
A. Transformers:
Transformers are used for data cleansing and manipulation within a single data source (e.g., changing text to lowercase, splitting fields, formatting dates). They are not used to create a new, unified dimension by combining values from multiple independent data sources.
B. Parent-Child:
Parent-Child is a data modeling relationship used to create a hierarchy between two related dimensions from the same data source (e.g., Country -> State -> City). It is not used to harmonize different fields from different sources into a single new dimension.
C. Fusion:
Fusion is a feature that combines metrics from different data sources into a single, new calculated metric (e.g., Total Conversions = Facebook Conversions + Google Ads Conversions). It works with metrics, not with creating new unified dimensions for slicing data.
E. Calculated Dimensions:
Calculated dimensions are created using functions and logic applied to existing fields within a single data source (e.g., CONCAT(FirstName, " ", LastName)). They cannot pull values from fields that exist in separate, unrelated data sources to create a harmonized field.
Reference:
This solution directly addresses the core objective of the Marketing Cloud Intelligence platform: to unify fragmented marketing data. The Custom Classification feature is the primary tool for achieving dimensional harmonization across multiple data connectors, a fundamental concept for the AP-215 exam.
Which two statements are correct regarding variable Dimensions in marketing Cloud intelligence’s data model?
A. These dimensions are stored at the workspace level
B. Variable Dimensions hold a Many-to-Many relationship with its main entity
C. All variables exist in every data set type, hence are considered as overarching dimensions
D. These are stand alone dimensions that pertain to the data set itself rather than to a specific entity
Explanation
In Marketing Cloud Intelligence, Variable Dimensions (frequently referred to as Standalone Dimensions or Dataset Dimensions) are flexible attributes that belong directly to a specific data stream/dataset rather than being embedded within the main hierarchical entities (such as Advertiser → Brand → Campaign → Ad). They act as additional context — like Device Category, Operating System, Browser, Country, or Platform — allowing analysts to slice and filter data broadly across the entire dataset without depending on the rigid entity structure. This makes them extremely useful for cross-entity analysis.
Correct Options:
B. Variable Dimensions hold a Many-to-Many relationship with its main entity
✅ Correct. Since Variable Dimensions are not locked to one specific entity in the model hierarchy, a single variable value (e.g., “iOS” as Operating System) can connect to many different entity records (multiple campaigns, ads, placements), and conversely, one entity record can be associated with multiple variable values. This many-to-many cardinality is a core characteristic that enables flexible, multi-dimensional reporting.
D. These are stand alone dimensions that pertain to the data set itself rather than to a specific entity
✅ Correct. Variable Dimensions are scoped at the data stream level — they are attributes of the incoming dataset as a whole, not children or properties of any particular entity like Campaign, Site, or Placement. That standalone nature is precisely what distinguishes them from regular entity-attached dimensions.
Incorrect Options:
A. These dimensions are stored at the workspace level
❌ Incorrect. The workspace is the top-level container that holds multiple data streams, classifications, measurement rules, user permissions, and global settings. Variable Dimensions, however, are created, mapped, and stored inside individual data streams, not at the workspace level itself.
C. All variables exist in every data set type, hence are considered as overarching dimensions
❌ Incorrect. While Variable Dimensions are “overarching” in the sense that they apply across the dataset (not just one entity), they are not guaranteed to exist in every data stream or dataset type. Their presence depends entirely on what fields the source provides and how they are mapped during data ingestion — different connectors and streams can have very different sets of Variable Dimensions.
Summary
Variable Dimensions are powerful, dataset-scoped attributes in Marketing Cloud Intelligence that exist independently of the main entity hierarchy. Their key strengths are the many-to-many relationship with entities (option B) and their standalone placement at the data stream level rather than being tied to a specific entity (option D). This design supports flexible, cross-cutting analysis without forcing rigid parent-child structures.
Reference
Salesforce Help: Understanding the Marketing Cloud Intelligence Data Model
Salesforce Help: Dimensions in Marketing Cloud Intelligence
Salesforce Help: Data Streams and Dataset-Level Dimensions (describes standalone / variable dimension behavior at dataset level)
An Implementation engineer is requested to create anew harmonization field 'Offer’and apply the following logic:
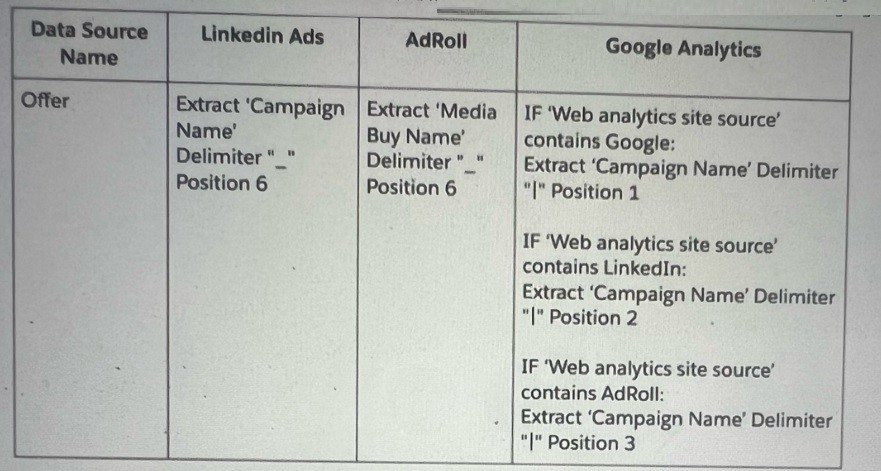
The implementation engineer to use the Harmonization Center. Which of the below actions can help implement the new dimension ‘Offer?
A. Two separate patterns (filtered by Linkedin or AdRoll sources) Within Google Analytics' mapping A formula that reflects the logic above will be populated within a Web Analytics Site custom attribute Another pattern to be created for the newly Web Analytics Site custom attribute (filtered by Google Analytics source). A total of 3 patterns.
B. Two separate patterns (filtered by Linkedin or AdRoll sources) Within Google Analytics' mapping: A formula that reflects the logic above will be populated within a Campaign custom attribute. Another pattern to be created for the newly campaign attribute (filtered by Google Analytics source). A total of 3 patterns
C. Two separate patterns (filtered by Linkedin or AdRoll sources). Another single pattern for Campaign Name (filtered by Google Analytics source). A total of 3 patterns.
D. Two separate patterns (filtered by Linkedln or AdRoll sources). Another single pattern for Web Analytics Site Source (filtered by Google Analytics source), extracting all three positions A total of 3 patterns.
Explanation:
To create a new harmonization field 'Offer' using the Harmonization Center, the Implementation engineer must ensure the logic is applied consistently across LinkedIn Ads, AdRoll, and Google Analytics sources.
The table specifies:
For LinkedIn Ads, 'Offer' is extracted from 'Campaign Name' at position 6 with a "_" delimiter.
For AdRoll, 'Offer' is extracted from 'Media Buy Name' at position 6 with a "_" delimiter.
For Google Analytics, 'Offer' is extracted from 'Campaign Name' with a "|" delimiter at position 1 if the 'Web analytics site source' contains "Google," position 2 if it contains "LinkedIn," or position 3 if it contains "AdRoll."
Option B is correct because it proposes two patterns for LinkedIn and AdRoll (covering their respective 'Campaign Name' and 'Media Buy Name' fields) and a third pattern for Google Analytics. It specifies using a Campaign custom attribute in Google Analytics to apply the conditional formula (based on 'Web analytics site source'), which aligns with the logic for extracting 'Offer' from 'Campaign Name' at different positions. A new pattern for this Campaign custom attribute ensures harmonization across all sources.
A is incorrect because using a Web Analytics Site custom attribute for Google Analytics doesn’t align with the logic, which relies on 'Campaign Name' rather than a site source attribute.
C is incorrect because it only mentions a pattern for 'Campaign Name' without addressing the conditional logic or a custom attribute, missing the formula application.
D is incorrect because it suggests using 'Web Analytics Site Source' and extracting all three positions, which doesn’t match the conditional extraction logic based on the source type.
Reference:
This approach follows the harmonization process outlined in Salesforce Marketing Cloud Intelligence documentation for multi-source data mapping.
A technical architect is provided with the logic and Opportunity file shown below:
The opportunity status logic is as follows:
For the opportunity stages “Interest”, “Confirmed Interest” and “Registered”, the status should be “Open”.
For the opportunity stage “Closed”, the opportunity status should be closed Otherwise, return null for the opportunity status.
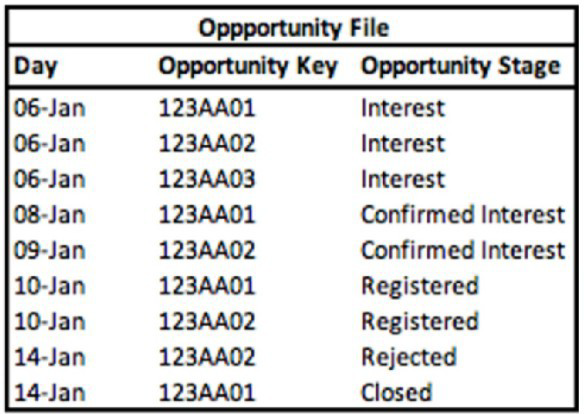
Given the above file and logic and assuming that the file is mapped in a generic data stream type with the following mapping
“Day” — Standard “Day” field
“Opportunity Key” > Main Generic Entity Key
“Opportunity Stage” + Generic Entity Key 2
A pivot table was created to present the count of opportunities in each stage. The pivot table is filtered on Jan 7th - 11th. Which option reflects the stage(s) the Opportunity key 123AA01 is associated with?
A. Registered
B. Interest & Registered
C. Confirmed Interest & Registered
D. Interest
E. Confirmed Interest
Explanation:
The filter (Jan 7th-11th) selects only the rows where the Day falls within that date range. We must look at all stages for Opportunity 123AA01 that occurred on those specific days.
Analysis of 123AA01 within Date Filter (Jan 7-11):
Jan 8: 123AA01 → Stage: Confirmed Interest
Jan 10: 123AA01 → Stage: Registered
No other entries for 123AA01 exist on Jan 7, 9, or 11.
✅ Correct Option:
C. Confirmed Interest & Registered.
This is correct because within the filtered date range of January 7th to 11th, the Opportunity Key 123AA01 has two relevant records: one on Jan 8th with the stage "Confirmed Interest" and one on Jan 10th with the stage "Registered."
❌ Incorrect Option:
A. Registered.
This is incomplete, as it misses the "Confirmed Interest" stage that also occurred within the date filter.
B. Interest & Registered.
"Interest" for this key occurred on Jan 6, which is outside the filtered date range.
D. Interest.
The "Interest" stage for this key (Jan 6) is excluded by the date filter.
E. Confirmed Interest.
This is incomplete, as it misses the "Registered" stage that also occurred within the date filter.
Summary:
When applying the date filter of January 7-11, only the stages that occurred on those specific dates for Opportunity 123AA01 are included. This results in two stages: Confirmed Interest (Jan 8) and Registered (Jan 10).
Reference:
Marketing Cloud Intelligence Help: "Working with Filters in Stories"
Which three entities and/or functions can be used in an expression when building a calculated dimension?
A. The VLOOKUP function
B. Mapped dimensions
C. The EXTRACT function
D. Calculated dimensions
E. Mapped measurements
Explanation
Calculated dimensions in Marketing Cloud Intelligence allow you to create new fields by applying logic to mapped data. They can reference mapped dimensions, mapped measurements, and supported functions like EXTRACT. Functions like VLOOKUP or other calculated dimensions cannot be used because they are either for data enrichment or are outputs, not base fields for expressions.
Correct Options
✅ B. Mapped dimensions
Mapped dimensions are fields imported into the data model and can be directly referenced in calculated dimension expressions. They enable categorization, segmentation, or combining of data logically, forming the foundation of calculated dimensions.
✅ C. The EXTRACT function
EXTRACT is a supported text function for calculated dimensions. It splits a string by a delimiter and returns a specific segment, allowing parsing of complex fields like campaign codes or identifiers to generate meaningful new dimensions.
✅ E. Mapped measurements
Mapped measurements are numeric fields that can be included in calculated dimension expressions. They allow logic such as categorizing data based on thresholds or conditions, extending the functionality of calculated dimensions beyond text fields.
Incorrect Options
❌ A. The VLOOKUP function
VLOOKUP is a data-harmonization function used during data import to enrich or join data. It cannot be referenced in calculated dimension expressions because calculated dimensions work only with mapped fields or supported functions.
❌ D. Calculated dimensions
You cannot use one calculated dimension inside another’s expression. Calculated dimensions are outputs of logic applied to mapped fields and functions; they are not valid input fields for other calculated dimensions.
Summary
Calculated dimension expressions can include mapped dimensions, mapped measurements, and supported functions like EXTRACT. VLOOKUP and other calculated dimensions are not allowed because they are either enrichment tools or outputs, not usable base fields.
Reference
Trailhead: Use Calculated Dimensions in Marketing Cloud Intelligence
Salesforce Exams: Marketing Cloud Intelligence Practice Questions
Salesforce Ben: Datorama Data Harmonization
What are unstable measurements?
A. Measurements for which Aggregation Settings are set as ‘Auto’ and Granularity is set as ‘None’.
B. Measurements that are set with the LIFETIME aggregation function
C. Measurements for which Aggregation Settings are set as ‘Not Auto’ and Granularity is set as ‘None’.
D. Measurements for which Aggregation Settings are set as ‘Not Auto’ and Granularity is set as ‘Not Empty’.
Explanation:
In Salesforce Marketing Cloud Intelligence, a measurement is considered unstable when:
Aggregation Settings are set to Not Auto (i.e., manual aggregation is applied),
Granularity is set to None, meaning the measurement lacks a defined time-based or entity-based grouping.
This combination causes instability because the platform cannot reliably determine how to aggregate the data across time or entities, leading to inconsistent or misleading results in dashboards and widgets.
🔍 Why the Other Options Are Incorrect:
A. Auto + None
Auto aggregation compensates for missing granularity, so the measurement remains stable.
B. LIFETIME aggregation
LIFETIME is a valid aggregation type and does not inherently cause instability.
D. Not Auto + Not Empty
This is actually a stable configuration — manual aggregation with defined granularity is acceptable.
📘 Reference:
You can find more on this in the Salesforce Help documentation on MDP Granularity in Calculated Measurements
A client wants to integrate their data within Marketing Cloud Intelligence to optimize their marketing Insights and cross-channel marketing activity analysis. Below are details regarding the different data sources and the number of data streams required for each source.
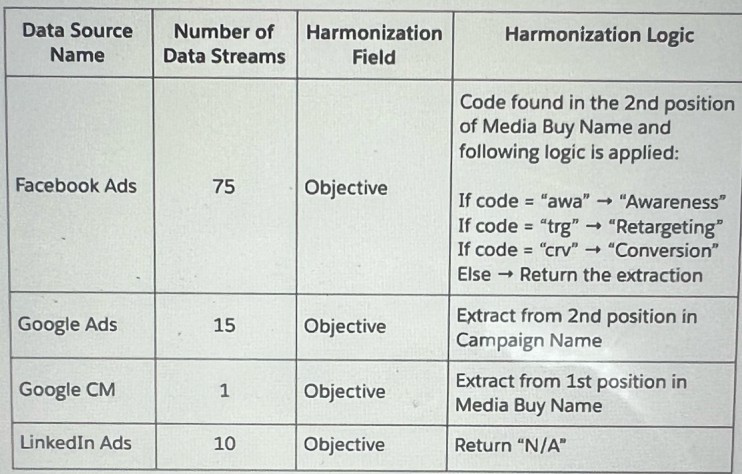
Which three advantages does a client gain from using Calculated Dimensions as the harmonization method for creating the Objective field?
A. Scalability - future data streams that will follow similar logic will be automatically harmonized.
B. Data model restrictions - Calculated Dimensions do not need to adhere to Marketing Cloud Intelligence's data model
C. Processing - creation of Calculated Dimensions will ease the processing time of the data streams it relates to
D. Ease of Maintenance - the logic is written and populated in one centralized place
E. Performance (Performance when loading a dashboard page) should be optimized as the values of calculated dimensions are stored within the database.
Explanation:
Using Calculated Dimensions as the harmonization method for creating the 'Objective' field in Marketing Cloud Intelligence offers several advantages, particularly for a client integrating multiple data sources (Facebook Ads, Google Ads, Google CM, LinkedIn Ads) with varying logic.
A. Scalability - future data streams that will follow similar logic will be automatically harmonized:
This is correct. Calculated Dimensions allow the client to define a reusable formula (e.g., extracting and mapping codes to "Awareness," "Retargeting," or "Conversion" for Facebook Ads, or positions for other sources). Future data streams adhering to the same logic can be automatically harmonized without manual reconfiguration, enhancing scalability.
D. Ease of Maintenance - the logic is written and populated in one centralized place:
This is correct. The harmonization logic (e.g., conditional statements for Facebook Ads or position extractions for Google Ads) is defined centrally within the Calculated Dimensions feature, making it easier to update or maintain across all data streams (75 for Facebook Ads, 15 for Google Ads, etc.) without altering individual source mappings.
E. Performance (Performance when loading a dashboard page) should be optimized as the values of calculated dimensions are stored within the database:
This is correct. Calculated Dimensions precompute and store values in the database, reducing the need for real-time calculations when loading dashboards, thus improving performance across the 101 total data streams.
B. Data model restrictions - Calculated Dimensions do not need to adhere to Marketing Cloud Intelligence's data model:
This is incorrect. Calculated Dimensions must align with the data model’s structure and rules, as they are built on existing dimensions and fields, not exempt from them.
C. Processing - creation of Calculated Dimensions will ease the processing time of the data streams it relates to:
This is incorrect. While Calculated Dimensions simplify logic application, they may increase initial processing time due to the computation involved, rather than easing it.
Reference:
This aligns with Salesforce Marketing Cloud Intelligence’s documentation on Calculated Dimensions, which emphasizes scalability, centralized maintenance, and performance benefits.
A client's data consists of three data streams as follows:
Data Stream A:
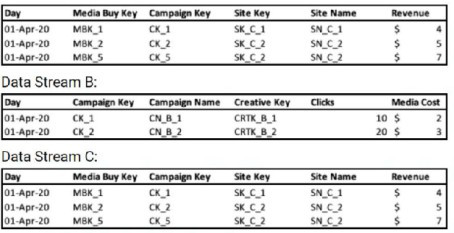
* The data streams should be linked together through a parent-child relationship.
* Out of the three data streams, Data Stream C is considered the source of truth for both the dimensions and measurements.
How should the "Override Media Buy Hierarchies” checkbox be set in order to meet the client's requirements?
A. It should be checked in Data Stream C
B. It should not be checked in any of the three Data Streams.
C. It should be checked in Data Stream B
D. It should be checked in Data Stream A
Explanation:
The client has two key requirements:
Data Stream C is the source of truth for both dimensions and measurements.
The data streams should be linked through a parent-child relationship.
The "Override Media Buy Hierarchies" checkbox is a powerful setting that dictates which data stream provides the authoritative definition of the Media Buy hierarchy (i.e., the relationship between Media Buy Key, Campaign Key, and other related dimensions).
Why A is Correct:
By checking "Override Media Buy Hierarchies" in Data Stream C, you are explicitly telling the platform to use the dimensions (like Media Buy Key, Campaign Key, Site Key, Site Name) from Data Stream C as the master definitions for the entire data model. This ensures that the hierarchical structure and dimension values from the designated "source of truth" are used to organize and link the data from all other streams (A and B). This action fulfills both requirements: it establishes C as the source of truth and is the necessary step to correctly form the parent-child relationships based on that truth.
Why the Other Options are Incorrect:
B. It should not be checked in any of the three Data Streams:
If this box is not checked in any stream, the platform will not know which stream to use as the master for the Media Buy hierarchy. This would likely lead to a default behavior that does not respect the requirement that Data Stream C is the source of truth, potentially causing data duplication or misalignment.
C. It should be checked in Data Stream B:
Data Stream B is not the source of truth. It contains different dimensions (Creative Key, Campaign Name) and lacks the Site Key and Site Name dimensions present in A and C. Making B the hierarchy master would ignore the client's explicit requirement and result in an incorrect data model.
D. It should be checked in Data Stream A:
While Data Stream A has the same structure as C, the client has specifically stated that Data Stream C is the source of truth. Therefore, C must be chosen as the master hierarchy stream to ensure consistency and accuracy.
Reference:
This aligns with the MCI data modeling principle of using a single, authoritative source for dimensions to build accurate and non-duplicative relationships across multiple data streams. The "Override" checkbox is the primary tool for defining this authoritative source.
A client's data consists of three data streams as follows:
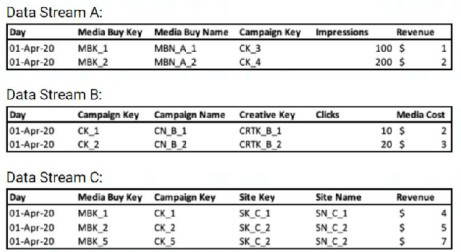
* The data streams should be linked together through a parent-child relationship.
* Out of the three data streams, Data Stream C is considered the source of truth for both the dimensions and measurements.
* Data Stream C was set as a ‘Parent’, and the ‘Override Media Buy Hierarchy’ checkbox is checked
What should the Data Updates Permissions be set to for Data Stream B?
A. There is no difference, all permissions will have a similar effect given the scenario.
B. Update Attributes and Hierarchies
C. Update Attributes
D. Inherit Attributes and Hierarchies
Explanation
In this setup, Data Stream C acts as the parent with 'Override Media Buy Hierarchy' enabled, making it the source of truth for dimensions and metrics. Child streams like Data Stream B should inherit from the parent to align hierarchies and attributes without overriding them. Setting permissions to 'Inherit Attributes and Hierarchies' ensures Data Stream B pulls updates from C, preventing conflicts while maintaining consistency across streams.
Correct Option
✅ D. Inherit Attributes and Hierarchies
This option fits perfectly since C is the parent and source of truth. It directs B to adopt C's attributes and hierarchy structure during ingestion, ensuring unified media buy, campaign, and other dimensions. No overrides occur, keeping C in control as intended.
Incorrect Options
❌ A. There is no difference, all permissions will have a similar effect given the scenario.
Permissions vary significantly: 'Update Attributes' refreshes only attributes, 'Update Attributes and Hierarchy' alters both but requires override unchecked (not possible here), and 'Inherit' pulls from parent. They produce different outcomes based on parent-child dynamics.
❌ B. Update Attributes and Hierarchies
This would attempt to push B's attributes and hierarchy to the parent pool, but with C's override checked, it's incompatible and unavailable. It contradicts C being the sole source of truth, risking hierarchy mismatches.
❌ C. Update Attributes
This updates only attributes from B into the shared pool, ignoring full hierarchy inheritance needed here. Since C dictates hierarchy via override, B shouldn't update anything—inheritance maintains alignment without partial changes.
Summary
Parent C with override controls the hierarchy; B as child must inherit to follow suit. Other permissions either conflict or partially update, breaking the source-of-truth rule. Use inheritance for clean, dependent data flow.
Reference:
Salesforce Help - Parent-Child Connections in Marketing Cloud Intelligence
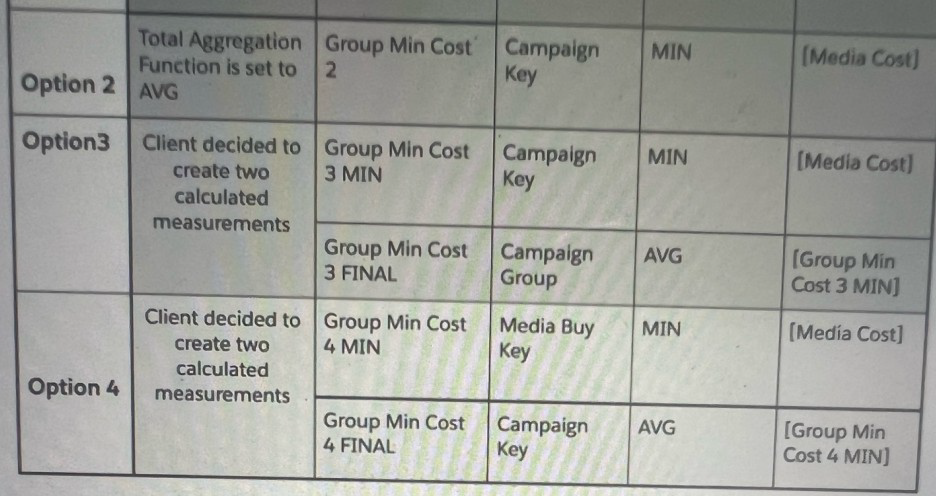
Which option will yield the desired result:?
A. Option 1
B. Option 4
C. Option 2
D. Option 3
Explanation:
The client's goal is to create a final calculated measurement, likely for a Media Cost, by first finding a minimum value at a specific level and then aggregating that minimum value. Let's break down the logic for each option:
Option 1:
The provided image does not include an "Option 1."
Option 2:
This option sets the "Total Aggregation Function" to AVG and groups by a "Group Min Cost." This is an incorrect approach as it averages a pre-aggregated value, which may not be the desired outcome. The logic is incomplete, so it's impossible to determine if it meets the requirements.
Option 3:
This option creates a calculated measurement called Group Min Cost 3 MIN using MIN aggregation on [Media Cost] grouped by Campaign Key. This is a valid first step. However, the second calculated measurement, Group Min Cost 3 FINAL, takes the AVG of the Group Min Cost 3 MIN and groups it by Campaign Group. This does not match the desired logic of grouping at the Media Buy Key level as seen in Option 4, which is typically a more granular level of a campaign hierarchy.
Option 4:
This option correctly outlines a two-step process to achieve the desired result.
First Calculated Measurement: Group Min Cost 4 MIN is created using the MIN aggregation of [Media Cost], grouped by the Media Buy Key. This is a logical first step to get the lowest cost for each specific media buy.
Second Calculated Measurement: Group Min Cost 4 FINAL then takes the AVG of [Group Min Cost 4 MIN] and groups it by the Campaign Key. This correctly aggregates the minimum media buy costs to the campaign level, which is a common reporting need.
Summary:
The logic in Option 4 directly addresses a common scenario in marketing analytics: finding the minimum cost at a lower level of a hierarchy (Media Buy Key) and then averaging or summing those minimums at a higher level (Campaign Key). This two-step process is the standard way to handle these types of aggregations in Marketing Cloud Intelligence, making it the most likely correct option.
After uploading a standard file into Marketing Cloud intelligence via total Connect, you noticed that the number of rows uploaded (to the specific data stream) is NOT equal to the number of rows present in the source file. What are two resource that may cause this gap?
A. All mapped Measurements for a given row have values equal to zero
B. Main entity is not mapped
C. The source file does not contain the mediaBuy entity
D. The file does not contain any measurements (dimension only)
Explanation:
When uploading a standard file into Salesforce Marketing Cloud Intelligence via Total Connect, discrepancies between the number of rows in the source file and those uploaded to a specific data stream can occur due to data processing rules.
A. All mapped Measurements for a given row have values equal to zero:
This is correct. Marketing Cloud Intelligence may exclude rows where all mapped measurement values (e.g., Impressions, Revenue) are zero, as these are often considered invalid or incomplete data points during the upload process, leading to a reduced row count.
B. Main entity is not mapped:
This is correct. The main entity (e.g., Campaign Key or Media Buy Key) is essential for structuring the data stream. If it is not mapped correctly or is missing, the system may reject or filter out rows, causing a gap between the source file and uploaded rows.
C. The source file does not contain the mediaBuy entity:
This is incorrect. The absence of a Media Buy entity might affect specific analyses but does not inherently cause rows to be excluded during upload, as long as other required entities or mappings are present.
D. The file does not contain any measurements (dimension only):
This is incorrect. A file with only dimensions (no measurements) can still be uploaded if properly mapped, though it may not contribute to measurement-based insights; it wouldn’t necessarily reduce row count unless other validation rules fail.
Reference:
This aligns with Marketing Cloud Intelligence’s data ingestion and validation rules, as described in the platform’s documentation for file uploads via Total Connect.
A client Ingested the following We into Marketing Cloud Intelligence:
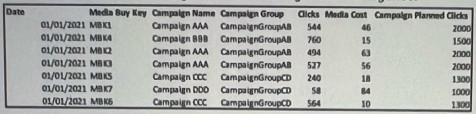
The mapping of the above file can be seen below:
Date — Day
Media Buy Key — Media Buy Key
Campaign Name — Campaign Name
Campaign Group -. Campaign Custom Attribute 01
Clicks —> Clicks
Media Cost —> Media Cost
Campaign Planned Clicks —> Delivery Custom Metric 01
The client would like to have a "Campaign Planned Clicks" measurement.
This measurement should return the "Campaign Planned Clicks" value per Campaign, for
example:
For Campaign Name 'Campaign AAA", the "Campaign Planned Clicks" should be 2000, rather than 6000 (the total sum by the number of Media Buy keys).
In order to create this measurement, the client considered multiple approaches. Please review the different approaches and answer the following question:
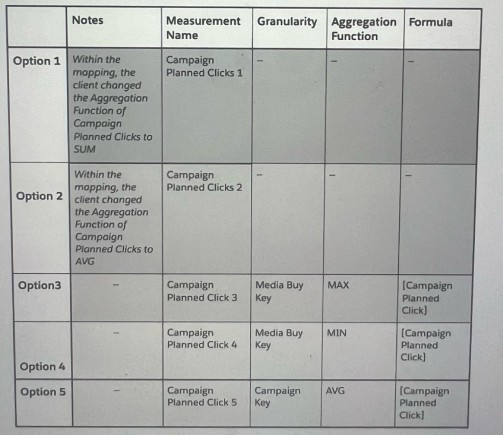
Which two options will yield a false result:
A. Option 2
B. Option 5
C. Option 3
D. Option 4
E. Option 1
Explanation:
The client wants the "Campaign Planned Clicks" measurement to return the value per Campaign, not aggregated across multiple Media Buy Keys. For example:
Campaign "AAA" has a planned value of 2000, regardless of how many Media Buy Keys it contains.
Currently, the raw data has multiple rows per campaign (e.g., "Campaign AAA" appears 3 times with the same planned value of 2000).
Let's evaluate each option:
Option 1: Change Aggregation Function to SUM
This would sum the planned clicks across all Media Buy Keys. For "Campaign AAA", it would return 2000 + 2000 + 2000 = 6000, which is incorrect (should be 2000).
Option 2: Change Aggregation Function to AVG
This would average the planned clicks across Media Buy Keys. For "Campaign AAA", it would return (2000 + 2000 + 2000) / 3 = 2000, which accidentally gives the right number in this case because all values are identical.
However, this is unreliable. If a campaign had different planned values for different Media Buys (e.g., 1000 and 3000), the average would be 2000, which might not be the intended per-campaign value. The client explicitly wants the value "per Campaign", not the average. Thus, this method is flawed and yields a false result in general.
Option 3: MAX at Media Buy Key Granularity
This calculates the maximum planned clicks per Media Buy Key. Since each Media Buy Key has only one value (e.g., each row has 2000 for "Campaign AAA"), this returns the same value. When rolled up to Campaign level, it will correctly show 2000 for "Campaign AAA". This works.
Option 4: MIN at Media Buy Key Granularity
Similar to Option 3, since each Media Buy Key has the same value for a given campaign, the min is also 2000. When rolled up to Campaign, it remains 2000. This also works.
Option 5: AVG at Campaign Key Granularity
This averages the planned clicks per Campaign Key. Since all Media Buy Keys under the same campaign have the same value (2000), the average is 2000. This returns the correct result.
Why Options 1 and 2 are False:
Option 1 (SUM) clearly gives 6000 for "Campaign AAA", which is wrong.
Option 2 (AVG) seems correct only by coincidence because all values are identical. If the planned values were not uniform (e.g., if a campaign had values 1000, 2000, 3000), the average would be 2000, but the true "per campaign" value might be defined as 3000 or 1000 in the business logic. Since the client wants the value "per Campaign" (which is 2000 in this case), using AVG is not robust and is considered a false approach.
Conclusion:
Options 1 and 2 are incorrect because they do not reliably return the intended per-campaign value. Thus, the two options that yield a false result are A. Option 2 and E. Option 1.
| Page 1 out of 5 Pages |