A manufacturing company stores production volume data in a PostgreSQL database.
The company needs an end-to-end solution that will give business analysts the ability to
prepare data for processing and to predict future production volume based the previous
year's production volume. The solution must not require the company to have coding
knowledge.
Which solution will meet these requirements with the LEAST effort?
A. Use AWS Database Migration Service (AWS DMS) to transfer the data from the PostgreSQL database to an Amazon S3 bucket. Create an Amazon EMR cluster to read the S3 bucket and perform the data preparation. Use Amazon SageMaker Studio for the prediction modeling.
B. Use AWS Glue DataBrew to read the data that is in the PostgreSQL database and to perform the data preparation. Use Amazon SageMaker Canvas for the prediction modeling.
C. Use AWS Database Migration Service (AWS DMS) to transfer the data from the PostgreSQL database to an Amazon S3 bucket. Use AWS Glue to read the data in the S3 bucket and to perform the data preparation. Use Amazon SageMaker Canvas for the prediction modeling.
D. Use AWS Glue DataBrew to read the data that is in the PostgreSQL database and to perform the data preparation. Use Amazon SageMaker Studio for the prediction modeling.
Explanation: AWS Glue DataBrew provides a no-code data preparation interface that
enables business analysts to clean and transform data from various sources, including
PostgreSQL databases, without needing programming skills. Amazon SageMaker Canvas
offers a no-code interface for machine learning model training and predictions, allowing
users to predict future production volume without coding expertise.
This solution meets the requirements efficiently by providing end-to-end data preparation
and prediction modeling without requiring coding.
A machine learning engineer is building a bird classification model. The engineer randomly separates a dataset into a training dataset and a validation dataset. During the training phase, the model achieves very high accuracy. However, the model did not generalize well during validation of the validation dataset. The engineer realizes that the original dataset was imbalanced. What should the engineer do to improve the validation accuracy of the model?
A. Perform stratified sampling on the original dataset.
B. Acquire additional data about the majority classes in the original dataset.
C. Use a smaller, randomly sampled version of the training dataset.
D. Perform systematic sampling on the original dataset.
Explanation: Stratified sampling is a technique that preserves the class distribution of the
original dataset when creating a smaller or split dataset. This means that the proportion of
examples from each class in the original dataset is maintained in the smaller or split
dataset. Stratified sampling can help improve the validation accuracy of the model by
ensuring that the validation dataset is representative of the original dataset and not biased
towards any class. This can reduce the variance and overfitting of the model and increase
its generalization ability. Stratified sampling can be applied to both oversampling and under sampling methods, depending on whether the goal is to increase or decrease the size of the dataset.
The other options are not effective ways to improve the validation accuracy of the model.
Acquiring additional data about the majority classes in the original dataset will only increase
the imbalance and make the model more biased towards the majority classes. Using a
smaller, randomly sampled version of the training dataset will not guarantee that the class
distribution is preserved and may result in losing important information from the minority
classes. Performing systematic sampling on the original dataset will also not ensure that
the class distribution is preserved and may introduce sampling bias if the original dataset is
ordered or grouped by class.
While reviewing the histogram for residuals on regression evaluation data a Machine Learning Specialist notices that the residuals do not form a zero-centered bell shape as shown What does this mean?
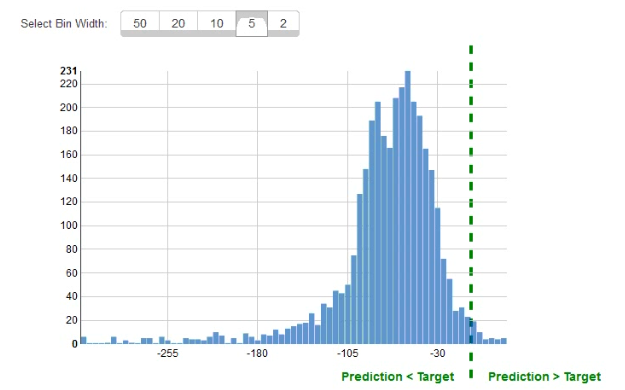
A. The model might have prediction errors over a range of target values.
B. The dataset cannot be accurately represented using the regression model
C. There are too many variables in the model
D. The model is predicting its target values perfectly.
Explanation: Residuals are the differences between the actual and predicted values of the target variable in a regression model. A histogram of residuals is a graphical tool that can help evaluate the performance and assumptions of the model. Ideally, the histogram of residuals should have a zero-centered bell shape, which indicates that the residuals are normally distributed with a mean of zero and a constant variance. This means that the model has captured the true relationship between the input and output variables, and that the errors are random and unbiased. However, if the histogram of residuals does not have a zero-centered bell shape, as shown in the image, this means that the model might have prediction errors over a range of target values. This is because the residuals do not form a symmetrical and homogeneous distribution around zero, which implies that the model has some systematic bias or heteroscedasticity. This can affect the accuracy and validity of the model, and indicate that the model needs to be improved or modified.
A retail company intends to use machine learning to categorize new products A labeled dataset of current products was provided to the Data Science team The dataset includes 1 200 products The labeled dataset has 15 features for each product such as title dimensions, weight, and price Each product is labeled as belonging to one of six categories such as books, games, electronics, and movies. Which model should be used for categorizing new products using the provided dataset for training?
A. An XGBoost model where the objective parameter is set to multi: softmax
B. A deep convolutional neural network (CNN) with a softmax activation function for the last layer
C. A regression forest where the number of trees is set equal to the number of product categories
D. A DeepAR forecasting model based on a recurrent neural network (RNN)
Explanation: XGBoost is a machine learning framework that can be used for classification, regression, ranking, and other tasks. It is based on the gradient boosting algorithm, which builds an ensemble of weak learners (usually decision trees) to produce a strong learner. XGBoost has several advantages over other algorithms, such as scalability, parallelization, regularization, and sparsity handling. For categorizing new products using the provided dataset, an XGBoost model would be a suitable choice, because it can handle multiple features and multiple classes efficiently and accurately. To train an XGBoost model for multi-class classification, the objective parameter should be set to multi: softmax, which means that the model will output a probability distribution over the classes and predict the class with the highest probability. Alternatively, the objective parameter can be set to multi: softprob, which means that the model will output the raw probability of each class instead of the predicted class label. This can be useful for evaluating the model performance or for post-processing the predictions.
A company uses camera images of the tops of items displayed on store shelves to determine which items were removed and which ones still remain. After several hours of data labeling, the company has a total of 1,000 hand-labeled images covering 10 distinct items. The training results were poor. Which machine learning approach fulfills the company’s long-term needs?
A. Convert the images to grayscale and retrain the model
B. Reduce the number of distinct items from 10 to 2, build the model, and iterate
C. Attach different colored labels to each item, take the images again, and build the model
D. Augment training data for each item using image variants like inversions and translations, build the model, and iterate.
Explanation: Data augmentation is a technique that can increase the size and diversity of the training data by applying various transformations to the original images, such as inversions, translations, rotations, scaling, cropping, flipping, and color variations. Data augmentation can help improve the performance and generalization of image classification models by reducing overfitting and introducing more variability to the data. Data augmentation is especially useful when the original data is limited or imbalanced, as in the case of the company’s problem. By augmenting the training data for each item using image variants, the company can build a more robust and accurate model that can recognize the items on the store shelves from different angles, positions, and lighting conditions. The company can also iterate on the model by adding more data or fine-tuning the hyperparameters to achieve better results.
A company wants to enhance audits for its machine learning (ML) systems. The auditing system must be able to perform metadata analysis on the features that the ML models use. The audit solution must generate a report that analyzes the metadata. The solution also must be able to set the data sensitivity and authorship of features. Which solution will meet these requirements with the LEAST development effort?
A. Use Amazon SageMaker Feature Store to select the features. Create a data flow to perform feature-level metadata analysis. Create an Amazon DynamoDB table to store feature-level metadata. Use Amazon QuickSight to analyze the metadata.
B. Use Amazon SageMaker Feature Store to set feature groups for the current features that the ML models use. Assign the required metadata for each feature. Use SageMaker Studio to analyze the metadata.
C. Use Amazon SageMaker Features Store to apply custom algorithms to analyze the feature-level metadata that the company requires. Create an Amazon DynamoDB table to store feature-level metadata. Use Amazon QuickSight to analyze the metadata.
D. Use Amazon SageMaker Feature Store to set feature groups for the current features that the ML models use. Assign the required metadata for each feature. Use Amazon QuickSight to analyze the metadata.
Explanation: The solution that will meet the requirements with the least development effort
is to use Amazon SageMaker Feature Store to set feature groups for the current features
that the ML models use, assign the required metadata for each feature, and use Amazon
QuickSight to analyze the metadata. This solution can leverage the existing AWS services and features to perform feature-level metadata analysis and reporting.
Amazon SageMaker Feature Store is a fully managed, purpose-built repository to store,
update, search, and share machine learning (ML) features. The service provides feature
management capabilities such as enabling easy feature reuse, low latency serving, time
travel, and ensuring consistency between features used in training and inference
workflows. A feature group is a logical grouping of ML features whose organization and
structure is defined by a feature group schema. A feature group schema consists of a list of
feature definitions, each of which specifies the name, type, and metadata of a feature. The
metadata can include information such as data sensitivity, authorship, description, and
parameters. The metadata can help make features discoverable, understandable, and
traceable. Amazon SageMaker Feature Store allows users to set feature groups for the
current features that the ML models use, and assign the required metadata for each feature
using the AWS SDK for Python (Boto3), AWS Command Line Interface (AWS CLI), or
Amazon SageMaker Studio1.
Amazon QuickSight is a fully managed, serverless business intelligence service that makes
it easy to create and publish interactive dashboards that include ML insights. Amazon
QuickSight can connect to various data sources, such as Amazon S3, Amazon Athena,
Amazon Redshift, and Amazon SageMaker Feature Store, and analyze the data using
standard SQL or built-in ML-powered analytics. Amazon QuickSight can also create rich
visualizations and reports that can be accessed from any device, and securely shared with
anyone inside or outside an organization. Amazon QuickSight can be used to analyze the
metadata of the features stored in Amazon SageMaker Feature Store, and generate a
report that summarizes the metadata analysis2.
The other options are either more complex or less effective than the proposed solution.
Using Amazon SageMaker Data Wrangler to select the features and create a data flow to
perform feature-level metadata analysis would require additional steps and resources, and
may not capture all the metadata attributes that the company requires. Creating an
Amazon DynamoDB table to store feature-level metadata would introduce redundancy and
inconsistency, as the metadata is already stored in Amazon SageMaker Feature Store.
Using SageMaker Studio to analyze the metadata would not generate a report that can be
easily shared and accessed by the company.
A company is running a machine learning prediction service that generates 100 TB of predictions every day A Machine Learning Specialist must generate a visualization of the daily precision-recall curve from the predictions, and forward a read-only version to the Business team. Which solution requires the LEAST coding effort?
A. Run a daily Amazon EMR workflow to generate precision-recall data, and save the results in Amazon S3 Give the Business team read-only access to S3
B. Generate daily precision-recall data in Amazon QuickSight, and publish the results in a dashboard shared with the Business team
C. Run a daily Amazon EMR workflow to generate precision-recall data, and save the results in Amazon S3 Visualize the arrays in Amazon QuickSight, and publish them in a dashboard shared with the Business team
D. Generate daily precision-recall data in Amazon ES, and publish the results in a dashboard shared with the Business team.
Explanation: A precision-recall curve is a plot that shows the trade-off between the
precision and recall of a binary classifier as the decision threshold is varied. It is a useful
tool for evaluating and comparing the performance of different models. To generate a
precision-recall curve, the following steps are needed:
Calculate the precision and recall values for different threshold values using the
predictions and the true labels of the data.
Plot the precision values on the y-axis and the recall values on the x-axis for each
threshold value.
Optionally, calculate the area under the curve (AUC) as a summary metric of the
model performance.
Among the four options, option C requires the least coding effort to generate and share a
visualization of the daily precision-recall curve from the predictions. This option involves the
following steps:
Run a daily Amazon EMR workflow to generate precision-recall data: Amazon
EMR is a service that allows running big data frameworks, such as Apache Spark,
on a managed cluster of EC2 instances. Amazon EMR can handle large-scale
data processing and analysis, such as calculating the precision and recall values
for different threshold values from 100 TB of predictions. Amazon EMR supports
various languages, such as Python, Scala, and R, for writing the code to perform
the calculations. Amazon EMR also supports scheduling workflows using Apache
Airflow or AWS Step Functions, which can automate the daily execution of the
code.
Save the results in Amazon S3: Amazon S3 is a service that provides scalable,
durable, and secure object storage. Amazon S3 can store the precision-recall data
generated by Amazon EMR in a cost-effective and accessible way. Amazon S3
supports various data formats, such as CSV, JSON, or Parquet, for storing the
data. Amazon S3 also integrates with other AWS services, such as Amazon
QuickSight, for further processing and visualization of the data.
Visualize the arrays in Amazon QuickSight: Amazon QuickSight is a service that
provides fast, easy-to-use, and interactive business intelligence and data
visualization. Amazon QuickSight can connect to Amazon S3 as a data source and
import the precision-recall data into a dataset. Amazon QuickSight can then create
a line chart to plot the precision-recall curve from the dataset. Amazon QuickSight
also supports calculating the AUC and adding it as an annotation to the chart.
Publish them in a dashboard shared with the Business team: Amazon QuickSight
allows creating and publishing dashboards that contain one or more visualizations
from the datasets. Amazon QuickSight also allows sharing the dashboards with
other users or groups within the same AWS account or across different AWS
accounts. The Business team can access the dashboard with read-only
permissions and view the daily precision-recall curve from the predictions.
The other options require more coding effort than option C for the following reasons:
Option A: This option requires writing code to plot the precision-recall curve from
the data stored in Amazon S3, as well as creating a mechanism to share the plot
with the Business team. This can involve using additional libraries or tools, such as
matplotlib, seaborn, or plotly, for creating the plot, and using email, web, or cloud
services, such as AWS Lambda or Amazon SNS, for sharing the plot.
Option B: This option requires transforming the predictions into a format that
Amazon QuickSight can recognize and import as a data source, such as CSV,
JSON, or Parquet. This can involve writing code to process and convert the
predictions, as well as uploading them to a storage service, such as Amazon S3 or
Amazon Redshift, that Amazon QuickSight can connect to.
Option D: This option requires writing code to generate precision-recall data in
Amazon ES, as well as creating a dashboard to visualize the data. Amazon ES is
a service that provides a fully managed Elasticsearch cluster, which is mainly used
for search and analytics purposes. Amazon ES is not designed for generating
precision-recall data, and it requires using a specific data format, such as JSON,
for storing the data. Amazon ES also requires using a tool, such as Kibana, for
creating and sharing the dashboard, which can involve additional configuration and
customization steps.
The displayed graph is from a foresting model for testing a time series. Considering the graph only, which conclusion should a Machine Learning Specialist make about the behavior of the model?
A. The model predicts both the trend and the seasonality well.
B. The model predicts the trend well, but not the seasonality.
C. The model predicts the seasonality well, but not the trend.
D. The model does not predict the trend or the seasonality well.
A machine learning (ML) engineer has created a feature repository in Amazon SageMaker Feature Store for the company. The company has AWS accounts for development, integration, and production. The company hosts a feature store in the development account. The company uses Amazon S3 buckets to store feature values offline. The company wants to share features and to allow the integration account and the production account to reuse the features that are in the feature repository. Which combination of steps will meet these requirements? (Select TWO.)
A. Create an IAM role in the development account that the integration account and production account can assume. Attach IAM policies to the role that allow access to the feature repository and the S3 buckets.
B. Share the feature repository that is associated the S3 buckets from the development account to the integration account and the production account by using AWS Resource Access Manager (AWS RAM).
C. Use AWS Security Token Service (AWS STS) from the integration account and the production account to retrieve credentials for the development account.
D. Set up S3 replication between the development S3 buckets and the integration and production S3 buckets.
E. Create an AWS PrivateLink endpoint in the development account for SageMaker.
Explanation:
The combination of steps that will meet the requirements are to create an IAM role in the
development account that the integration account and production account can assume,
attach IAM policies to the role that allow access to the feature repository and the S3
buckets, and share the feature repository that is associated with the S3 buckets from the
development account to the integration account and the production account by using AWS
Resource Access Manager (AWS RAM). This approach will enable cross-account access and sharing of the features stored in Amazon SageMaker Feature Store and Amazon S3.
Amazon SageMaker Feature Store is a fully managed, purpose-built repository to store,
update, search, and share curated data used in training and prediction workflows. The
service provides feature management capabilities such as enabling easy feature reuse, low
latency serving, time travel, and ensuring consistency between features used in training
and inference workflows. A feature group is a logical grouping of ML features whose
organization and structure is defined by a feature group schema. A feature group schema
consists of a list of feature definitions, each of which specifies the name, type, and
metadata of a feature. Amazon SageMaker Feature Store stores the features in both an
online store and an offline store. The online store is a low-latency, high-throughput store
that is optimized for real-time inference. The offline store is a historical store that is backed
by an Amazon S3 bucket and is optimized for batch processing and model training1.
AWS Identity and Access Management (IAM) is a web service that helps you securely
control access to AWS resources for your users. You use IAM to control who can use your
AWS resources (authentication) and what resources they can use and in what ways
(authorization). An IAM role is an IAM identity that you can create in your account that has
specific permissions. You can use an IAM role to delegate access to users, applications, or
services that don’t normally have access to your AWS resources. For example, you can
create an IAM role in your development account that allows the integration account and the
production account to assume the role and access the resources in the development
account. You can attach IAM policies to the role that specify the permissions for the feature
repository and the S3 buckets. You can also use IAM conditions to restrict the access
based on the source account, IP address, or other factors2.
AWS Resource Access Manager (AWS RAM) is a service that enables you to easily and
securely share AWS resources with any AWS account or within your AWS Organization.
You can share AWS resources that you own with other accounts using resource shares. A
resource share is an entity that defines the resources that you want to share, and the
principals that you want to share with. For example, you can share the feature repository
that is associated with the S3 buckets from the development account to the integration
account and the production account by creating a resource share in AWS RAM. You can
specify the feature group ARN and the S3 bucket ARN as the resources, and the
integration account ID and the production account ID as the principals. You can also use
IAM policies to further control the access to the shared resources3.
The other options are either incorrect or unnecessary. Using AWS Security Token Service
(AWS STS) from the integration account and the production account to retrieve credentials
for the development account is not required, as the IAM role in the development account
can provide temporary security credentials for the cross-account access. Setting up S3
replication between the development S3 buckets and the integration and production S3
buckets would introduce redundancy and inconsistency, as the S3 buckets are already
shared through AWS RAM. Creating an AWS PrivateLink endpoint in the development
account for SageMaker is not relevant, as it is used to securely connect to SageMaker
services from a VPC, not from another account.
A Machine Learning Specialist is building a logistic regression model that will predict whether or not a person will order a pizza. The Specialist is trying to build the optimal model with an ideal classification threshold. What model evaluation technique should the Specialist use to understand how different classification thresholds will impact the model's performance?
A. Receiver operating characteristic (ROC) curve
B. Misclassification rate
C. Root Mean Square Error (RM&)
D. L1 norm
Explanation: A receiver operating characteristic (ROC) curve is a model evaluation technique that can be used to understand how different classification thresholds will impact the model’s performance. A ROC curve plots the true positive rate (TPR) against the false positive rate (FPR) for various values of the classification threshold. The TPR, also known as sensitivity or recall, is the proportion of positive instances that are correctly classified as positive. The FPR, also known as the fall-out, is the proportion of negative instances that are incorrectly classified as positive. A ROC curve can show the trade-off between the TPR and the FPR for different thresholds, and help the Machine Learning Specialist to select the optimal threshold that maximizes the TPR and minimizes the FPR. A ROC curve can also be used to compare the performance of different models by calculating the area under the curve (AUC), which is a measure of how well the model can distinguish between the positive and negative classes. A higher AUC indicates a better model.
A Mobile Network Operator is building an analytics platform to analyze and optimize a company's operations using Amazon Athena and Amazon S3.
The source systems send data in CSV format in real lime The Data Engineering team
wants to transform the data to the Apache Parquet format before storing it on Amazon S3.
Which solution takes the LEAST effort to implement?
A. Ingest .CSV data using Apache Kafka Streams on Amazon EC2 instances and use Kafka Connect S3 to serialize data as Parquet
B. Ingest .CSV data from Amazon Kinesis Data Streams and use Amazon Glue to convert data into Parquet.
C. Ingest .CSV data using Apache Spark Structured Streaming in an Amazon EMR cluster and use Apache Spark to convert data into Parquet.
D. Ingest .CSV data from Amazon Kinesis Data Streams and use Amazon Kinesis Data Firehose to convert data into Parquet.
Explanation: Amazon Kinesis Data Streams is a service that can capture, store, and process streaming data in real time. Amazon Kinesis Data Firehose is a service that can deliver streaming data to various destinations, such as Amazon S3, Amazon Redshift, or Amazon Elasticsearch Service. Amazon Kinesis Data Firehose can also transform the data before delivering it, such as converting the data format, compressing the data, or encrypting the data. One of the supported data formats that Amazon Kinesis Data Firehose can convert to is Apache Parquet, which is a columnar storage format that can improve the performance and cost-efficiency of analytics queries. By using Amazon Kinesis Data Streams and Amazon Kinesis Data Firehose, the Mobile Network Operator can ingest the .CSV data from the source systems and use Amazon Kinesis Data Firehose to convert the data into Parquet before storing it on Amazon S3. This solution takes the least effort to implement, as it does not require any additional resources, such as Amazon EC2 instances, Amazon EMR clusters, or Amazon Glue jobs. The solution can also leverage the built-in features of Amazon Kinesis Data Firehose, such as data buffering, batching, retry, and error handling.
A machine learning (ML) engineer is preparing a dataset for a classification model. The ML
engineer notices that some continuous numeric features have a significantly greater value
than most other features. A business expert explains that the features are independently
informative and that the dataset is representative of the target distribution.
After training, the model's inferences accuracy is lower than expected.
Which preprocessing technique will result in the GREATEST increase of the model's
inference accuracy?
A. Normalize the problematic features.
B. Bootstrap the problematic features.
C. Remove the problematic features.
D. Extrapolate synthetic features.
Explanation: In a classification model, features with significantly larger scales can
dominate the model training process, leading to poor performance. Normalization scales
the values of continuous features to a uniform range, such as [0, 1], which prevents large value
features from disproportionately influencing the model. This is particularly beneficial
for algorithms sensitive to the scale of input data, such as neural networks or distance based algorithms.
Given that the problematic features are informative and representative of the target
distribution, removing or bootstrapping these features is not advisable. Normalization will
bring all features to a similar scale and improve the model's inference accuracy without
losing important information.
| Page 9 out of 26 Pages |
| 56789101112 |
| MLS-C01 Practice Test Home |
Real-World Scenario Mastery: Our MLS-C01 practice exam don't just test definitions. They present you with the same complex, scenario-based problems you'll encounter on the actual exam.
Strategic Weakness Identification: Each practice session reveals exactly where you stand. Discover which domains need more attention, before AWS Certified Machine Learning - Specialty exam day arrives.
Confidence Through Familiarity: There's no substitute for knowing what to expect. When you've worked through our comprehensive MLS-C01 practice exam questions pool covering all topics, the real exam feels like just another practice session.
Copyright © All Rights Reserved