A data scientist uses Amazon SageMaker Data Wrangler to define and perform
transformations and feature engineering on historical data. The data scientist saves the
transformations to SageMaker Feature Store.
The historical data is periodically uploaded to an Amazon S3 bucket. The data scientist
needs to transform the new historic data and add it to the online feature store The data
scientist needs to prepare the .....historic data for training and inference by using native
integrations.
Which solution will meet these requirements with the LEAST development effort?
A. Use AWS Lambda to run a predefined SageMaker pipeline to perform the transformations on each new dataset that arrives in the S3 bucket.
B. Run an AWS Step Functions step and a predefined SageMaker pipeline to perform the transformations on each new dalaset that arrives in the S3 bucket
C. Use Apache Airflow to orchestrate a set of predefined transformations on each new dataset that arrives in the S3 bucket.
D. Configure Amazon EventBridge to run a predefined SageMaker pipeline to perform the transformations when a new data is detected in the S3 bucket.
Explanation: The best solution is to configure Amazon EventBridge to run a predefined SageMaker pipeline to perform the transformations when a new data is detected in the S3 bucket. This solution requires the least development effort because it leverages the native integration between EventBridge and SageMaker Pipelines, which allows you to trigger a pipeline execution based on an event rule. EventBridge can monitor the S3 bucket for new data uploads and invoke the pipeline that contains the same transformations and feature engineering steps that were defined in SageMaker Data Wrangler. The pipeline can then ingest the transformed data into the online feature store for training and inference. The other solutions are less optimal because they require more development effort and additional services. Using AWS Lambda or AWS Step Functions would require writing custom code to invoke the SageMaker pipeline and handle any errors or retries. Using Apache Airflow would require setting up and maintaining an Airflow server and DAGs, as well as integrating with the SageMaker API.
A data engineer is preparing a dataset that a retail company will use to predict the number
of visitors to stores. The data engineer created an Amazon S3 bucket. The engineer
subscribed the S3 bucket to an AWS Data Exchange data product for general economic
indicators. The data engineer wants to join the economic indicator data to an existing table
in Amazon Athena to merge with the business data. All these transformations must finish
running in 30-60 minutes.
Which solution will meet these requirements MOST cost-effectively?
A. Configure the AWS Data Exchange product as a producer for an Amazon Kinesis data stream. Use an Amazon Kinesis Data Firehose delivery stream to transfer the data to Amazon S3 Run an AWS Glue job that will merge the existing business data with the Athena table. Write the result set back to Amazon S3.
B. Use an S3 event on the AWS Data Exchange S3 bucket to invoke an AWS Lambda function. Program the Lambda function to use Amazon SageMaker Data Wrangler to merge the existing business data with the Athena table. Write the result set back to Amazon S3.
C. Use an S3 event on the AWS Data Exchange S3 bucket to invoke an AWS Lambda Function Program the Lambda function to run an AWS Glue job that will merge the existing business data with the Athena table Write the results back to Amazon S3.
D. Provision an Amazon Redshift cluster. Subscribe to the AWS Data Exchange product and use the product to create an Amazon Redshift Table Merge the data in Amazon Redshift. Write the results back to Amazon S3.
Explanation: The most cost-effective solution is to use an S3 event to trigger a Lambda function that uses SageMaker Data Wrangler to merge the data. This solution avoids the need to provision and manage any additional resources, such as Kinesis streams, Firehose delivery streams, Glue jobs, or Redshift clusters. SageMaker Data Wrangler provides a visual interface to import, prepare, transform, and analyze data from various sources, including AWS Data Exchange products. It can also export the data preparation workflow to a Python script that can be executed by a Lambda function. This solution can meet the time requirement of 30-60 minutes, depending on the size and complexity of the data.
A Data Scientist is developing a machine learning model to predict future patient outcomes
based on information collected about each patient and their treatment plans. The model
should output a continuous value as its prediction. The data available includes labeled
outcomes for a set of 4,000 patients. The study was conducted on a group of individuals
over the age of 65 who have a particular disease that is known to worsen with age.
Initial models have performed poorly. While reviewing the underlying data, the Data
Scientist notices that, out of 4,000 patient observations, there are 450 where the patient
age has been input as 0. The other features for these observations appear normal
compared to the rest of the sample population.
How should the Data Scientist correct this issue?
A. Drop all records from the dataset where age has been set to 0.
B. Replace the age field value for records with a value of 0 with the mean or median value from the dataset.
C. Drop the age feature from the dataset and train the model using the rest of the features.
D. Use k-means clustering to handle missing features.
Explanation: The best way to handle the missing values in the patient age feature is to replace them with the mean or median value from the dataset. This is a common technique for imputing missing values that preserves the overall distribution of the data and avoids introducing bias or reducing the sample size. Dropping the records or the feature would result in losing valuable information and reducing the accuracy of the model. Using kmeans clustering would not be appropriate for handling missing values in a single feature, as it is a method for grouping similar data points based on multiple features.
A company wants to segment a large group of customers into subgroups based on shared characteristics. The company’s data scientist is planning to use the Amazon SageMaker built-in k-means clustering algorithm for this task. The data scientist needs to determine the optimal number of subgroups (k) to use. Which data visualization approach will MOST accurately determine the optimal value of k?
A. Calculate the principal component analysis (PCA) components. Run the k-means clustering algorithm for a range of k by using only the first two PCA components. For each value of k, create a scatter plot with a different color for each cluster. The optimal value of k is the value where the clusters start to look reasonably separated.
B. Calculate the principal component analysis (PCA) components. Create a line plot of the number of components against the explained variance. The optimal value of k is the number of PCA components after which the curve starts decreasing in a linear fashion.
C. Create a t-distributed stochastic neighbor embedding (t-SNE) plot for a range of perplexity values. The optimal value of k is the value of perplexity, where the clusters start to look reasonably separated.
D. Run the k-means clustering algorithm for a range of k. For each value of k, calculate the sum of squared errors (SSE). Plot a line chart of the SSE for each value of k. The optimal value of k is the point after which the curve starts decreasing in a linear fashion.
Explanation: The solution D is the best data visualization approach to determine the
optimal value of k for the k-means clustering algorithm. The solution D involves the
following steps:
Run the k-means clustering algorithm for a range of k. For each value of k,
calculate the sum of squared errors (SSE). The SSE is a measure of how well the
clusters fit the data. It is calculated by summing the squared distances of each
data point to its closest cluster center. A lower SSE indicates a better fit, but it will
always decrease as the number of clusters increases. Therefore, the goal is to find
the smallest value of k that still has a low SSE1.
Plot a line chart of the SSE for each value of k. The line chart will show how the
SSE changes as the value of k increases. Typically, the line chart will have a
shape of an elbow, where the SSE drops rapidly at first and then levels off. The
optimal value of k is the point after which the curve starts decreasing in a linear
fashion. This point is also known as the elbow point, and it represents the balance
between the number of clusters and the SSE1.
The other options are not suitable because:
Option A: Calculating the principal component analysis (PCA) components,
running the k-means clustering algorithm for a range of k by using only the first two
PCA components, and creating a scatter plot with a different color for each cluster
will not accurately determine the optimal value of k. PCA is a technique that
reduces the dimensionality of the data by transforming it into a new set of features
that capture the most variance in the data. However, PCA may not preserve the
original structure and distances of the data, and it may lose some information in
the process. Therefore, running the k-means clustering algorithm on the PCA
components may not reflect the true clusters in the data. Moreover, using only the
first two PCA components may not capture enough variance to represent the data
well. Furthermore, creating a scatter plot may not be reliable, as it depends on the
subjective judgment of the data scientist to decide when the clusters look
reasonably separated2.
Option B: Calculating the PCA components and creating a line plot of the number
of components against the explained variance will not determine the optimal value
of k. This approach is used to determine the optimal number of PCA components
to use for dimensionality reduction, not for clustering. The explained variance is
the ratio of the variance of each PCA component to the total variance of the data.
The optimal number of PCA components is the point where adding more
components does not significantly increase the explained variance. However, this
number may not correspond to the optimal number of clusters, as PCA and kmeans
clustering have different objectives and assumptions2.
Option C: Creating a t-distributed stochastic neighbor embedding (t-SNE) plot for a
range of perplexity values will not determine the optimal value of k. t-SNE is a
technique that reduces the dimensionality of the data by embedding it into a lowerdimensional
space, such as a two-dimensional plane. t-SNE preserves the local
structure and distances of the data, and it can reveal clusters and patterns in the
data. However, t-SNE does not assign labels or centroids to the clusters, and it
does not provide a measure of how well the clusters fit the data. Therefore, t-SNE
cannot determine the optimal number of clusters, as it only visualizes the data.
Moreover, t-SNE depends on the perplexity parameter, which is a measure of how
many neighbors each point considers. The perplexity parameter can affect the
shape and size of the clusters, and there is no optimal value for it. Therefore,
creating a t-SNE plot for a range of perplexity values may not be consistent or
reliable3.
A company stores its documents in Amazon S3 with no predefined product categories. A data scientist needs to build a machine learning model to categorize the documents for all the company's products. Which solution will meet these requirements with the MOST operational efficiency?
A. Build a custom clustering model. Create a Dockerfile and build a Docker image. Register the Docker image in Amazon Elastic Container Registry (Amazon ECR). Use the custom image in Amazon SageMaker to generate a trained model.
B. Tokenize the data and transform the data into tabulai data. Train an Amazon SageMaker k-means mode to generate the product categories.
C. Train an Amazon SageMaker Neural Topic Model (NTM) model to generate the product categories.
D. Train an Amazon SageMaker Blazing Text model to generate the product categories.
Explanation: Amazon SageMaker’s Neural Topic Model (NTM) is designed to uncover
underlying topics within text data by clustering documents based on topic similarity. For
document categorization, NTM can identify product categories by analyzing and grouping
the documents, making it an efficient choice for unsupervised learning where predefined
categories do not exist.
This model minimizes operational overhead by allowing automated topic categorization
directly within SageMaker, which is more straightforward than custom Docker image setups
or using k-means clustering for tokenized data.
A Machine Learning Specialist prepared the following graph displaying the results of kmeans
for k = [1:10]
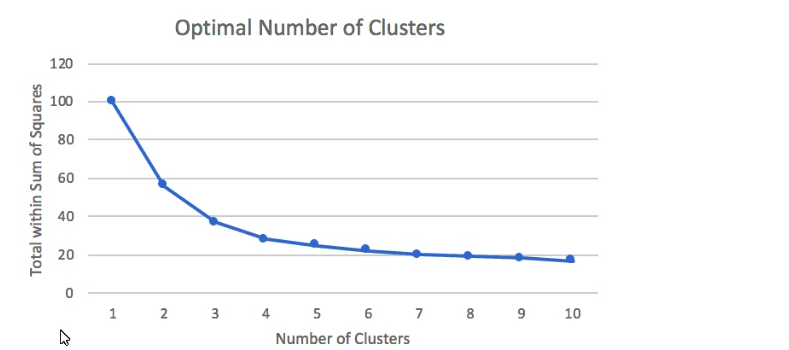
Considering the graph, what is a reasonable selection for the optimal choice of k?
A. 1
B. 4
C. 7
D. 10
Explanation: The elbow method is a technique that we use to determine the number of centroids (k) to use in a k-means clustering algorithm. In this method, we plot the withincluster sum of squares (WCSS) against the number of clusters (k) and look for the point where the curve bends sharply. This point is called the elbow point and it indicates that adding more clusters does not improve the model significantly. The graph in the question shows that the elbow point is at k = 4, which means that 4 is a reasonable choice for the optimal number of clusters.
A data engineer at a bank is evaluating a new tabular dataset that includes customer data. The data engineer will use the customer data to create a new model to predict customer behavior. After creating a correlation matrix for the variables, the data engineer notices that many of the 100 features are highly correlated with each other. Which steps should the data engineer take to address this issue? (Choose two.)
A. Use a linear-based algorithm to train the model.
B. Apply principal component analysis (PCA).
C. Remove a portion of highly correlated features from the dataset.
D. Apply min-max feature scaling to the dataset.
E. Apply one-hot encoding category-based variables.
Explanation:
B. Apply principal component analysis (PCA): PCA is a technique that reduces the
dimensionality of a dataset by transforming the original features into a smaller set
of new features that capture most of the variance in the data. PCA can help
address the issue of multicollinearity, which occurs when some features are highly
correlated with each other and can cause problems for some machine learning
algorithms. By applying PCA, the data engineer can reduce the number of features
and remove the redundancy in the data.
C. Remove a portion of highly correlated features from the dataset: Another way to
deal with multicollinearity is to manually remove some of the features that are
highly correlated with each other. This can help simplify the model and avoid
overfitting. The data engineer can use the correlation matrix to identify the features
that have a high correlation coefficient (e.g., above 0.8 or below -0.8) and remove
one of them from the dataset.
A manufacturing company wants to create a machine learning (ML) model to predict when equipment is likely to fail. A data science team already constructed a deep learning model by using TensorFlow and a custom Python script in a local environment. The company wants to use Amazon SageMaker to train the model. Which TensorFlow estimator configuration will train the model MOST cost-effectively?
A. Turn on SageMaker Training Compiler by adding compiler_config=TrainingCompilerConfig() as a parameter. Pass the script to the estimator in the call to the TensorFlow fit() method.
B. Turn on SageMaker Training Compiler by adding compiler_config=TrainingCompilerConfig() as a parameter. Turn on managed spot training by setting the use_spot_instances parameter to True. Pass the script to the estimator in the call to the TensorFlow fit() method.
C. Adjust the training script to use distributed data parallelism. Specify appropriate values for the distribution parameter. Pass the script to the estimator in the call to the TensorFlow fit() method.
D. Turn on SageMaker Training Compiler by adding compiler_config=TrainingCompilerConfig() as a parameter. Set the MaxWaitTimeInSeconds parameter to be equal to the MaxRuntimeInSeconds parameter. Pass the script to the estimator in the call to the TensorFlow fit() method.
A tourism company uses a machine learning (ML) model to make recommendations to
customers. The company uses an Amazon SageMaker environment and set
hyperparameter tuning completion criteria to MaxNumberOfTrainingJobs.
An ML specialist wants to change the hyperparameter tuning completion criteria. The ML
specialist wants to stop tuning immediately after an internal algorithm determines that
tuning job is unlikely to improve more than 1% over the objective metric from the best
training job.
Which completion criteria will meet this requirement?
A. axRuntimelnSeconds
B. TargetObjectiveMetricValue
C. CompleteOnConvergence
D. MaxNumberOfTrainingJobsNotlmproving
Explanation: In Amazon SageMaker, hyperparameter tuning jobs optimize model
performance by adjusting hyperparameters. Amazon SageMaker’s hyperparameter tuning
supports completion criteria settings that enable efficient management of tuning resources.
In this scenario, the ML specialist aims to set a completion criterion that will terminate the
tuning job as soon as SageMaker detects that further improvements in the objective metric
are unlikely to exceed 1%.
The CompleteOnConvergence setting is designed for such requirements. This criterion
enables the tuning job to automatically stop when SageMaker determines that additional
hyperparameter evaluations are unlikely to improve the objective metric beyond a certain
threshold, allowing for efficient tuning completion. The convergence process relies on an
internal optimization algorithm that continuously evaluates the objective metric during
tuning and stops when performance stabilizes without further improvement.
This is supported by AWS documentation, which explains that CompleteOnConvergence
is an efficient way to manage tuning by stopping unnecessary evaluations once the model
performance stabilizes within the specified threshold.
A Machine Learning Specialist is deciding between building a naive Bayesian model or a full Bayesian network for a classification problem. The Specialist computes the Pearson correlation coefficients between each feature and finds that their absolute values range between 0.1 to 0.95. Which model describes the underlying data in this situation?
A. A naive Bayesian model, since the features are all conditionally independent.
B. A full Bayesian network, since the features are all conditionally independent.
C. A naive Bayesian model, since some of the features are statistically dependent.
D. A full Bayesian network, since some of the features are statistically dependent.
Explanation: A naive Bayesian model assumes that the features are conditionally independent given the class label. This means that the joint probability of the features and the class can be factorized as the product of the class prior and the feature likelihoods. A full Bayesian network, on the other hand, does not make this assumption and allows for modeling arbitrary dependencies between the features and the class using a directed acyclic graph. In this case, the joint probability of the features and the class is given by the product of the conditional probabilities of each node given its parents in the graph. If the features are statistically dependent, meaning that their correlation coefficients are not close to zero, then a naive Bayesian model would not capture these dependencies and would likely perform worse than a full Bayesian network that can account for them. Therefore, a full Bayesian network describes the underlying data better in this situation.
A Machine Learning Specialist is working with a large cybersecurily company that manages security events in real time for companies around the world The cybersecurity company wants to design a solution that will allow it to use machine learning to score malicious events as anomalies on the data as it is being ingested The company also wants be able to save the results in its data lake for later processing and analysis. What is the MOST efficient way to accomplish these tasks'?
A. Ingest the data using Amazon Kinesis Data Firehose, and use Amazon Kinesis Data Analytics Random Cut Forest (RCF) for anomaly detection Then use Kinesis Data Firehose to stream the results to Amazon S3
B. Ingest the data into Apache Spark Streaming using Amazon EMR. and use Spark MLlib with k-means to perform anomaly detection Then store the results in an Apache Hadoop Distributed File System (HDFS) using Amazon EMR with a replication factor of three as the data lake
C. Ingest the data and store it in Amazon S3 Use AWS Batch along with the AWS Deep Learning AMIs to train a k-means model using TensorFlow on the data in Amazon S3.
D. Ingest the data and store it in Amazon S3. Have an AWS Glue job that is triggered on demand transform the new data Then use the built-in Random Cut Forest (RCF) model within Amazon SageMaker to detect anomalies in the data.
Explanation: Amazon Kinesis Data Firehose is a fully managed service that can capture, transform, and load streaming data into AWS data stores, such as Amazon S3, Amazon Redshift, Amazon Elasticsearch Service, and Splunk. It can also invoke AWS Lambda functions to perform custom transformations on the data. Amazon Kinesis Data Analytics is a service that can analyze streaming data in real time using SQL or Apache Flink applications. It can also use machine learning algorithms, such as Random Cut Forest (RCF), to perform anomaly detection on streaming data. RCF is an unsupervised learning algorithm that assigns an anomaly score to each data point based on how different it is from the rest of the data. By using Kinesis Data Firehose and Kinesis Data Analytics, the cybersecurity company can ingest the data in real time, score the malicious events as anomalies, and stream the results to Amazon S3, which can serve as a data lake for later processing and analysis. This is the most efficient way to accomplish these tasks, as it does not require any additional infrastructure, coding, or training.
A retail chain has been ingesting purchasing records from its network of 20,000 stores to
Amazon S3 using Amazon Kinesis Data Firehose To support training an improved machine
learning model, training records will require new but simple transformations, and some
attributes will be combined The model needs lo be retrained daily.
Given the large number of stores and the legacy data ingestion, which change will require
the LEAST amount of development effort?
A. Require that the stores to switch to capturing their data locally on AWS Storage Gateway for loading into Amazon S3 then use AWS Glue to do the transformation
B. Deploy an Amazon EMR cluster running Apache Spark with the transformation logic, and have the cluster run each day on the accumulating records in Amazon S3, outputting new/transformed records to Amazon S3
C. Spin up a fleet of Amazon EC2 instances with the transformation logic, have them transform the data records accumulating on Amazon S3, and output the transformed records to Amazon S3.
D. Insert an Amazon Kinesis Data Analytics stream downstream of the Kinesis Data Firehouse stream that transforms raw record attributes into simple transformed values using SQL.
Explanation: Amazon Kinesis Data Analytics is a service that can analyze streaming data in real time using SQL or Apache Flink applications. It can also use machine learning algorithms, such as Random Cut Forest (RCF), to perform anomaly detection on streaming data. By inserting a Kinesis Data Analytics stream downstream of the Kinesis Data Firehose stream, the retail chain can transform the raw record attributes into simple transformed values using SQL queries. This can be done without changing the existing data ingestion process or deploying additional resources. The transformed records can then be outputted to another Kinesis Data Firehose stream that delivers them to Amazon S3 for training the machine learning model. This approach will require the least amount of development effort, as it leverages the existing Kinesis Data Firehose stream and the builtin SQL capabilities of Kinesis Data Analytics.
| Page 11 out of 26 Pages |
| 7891011121314 |
| MLS-C01 Practice Test Home |
Real-World Scenario Mastery: Our MLS-C01 practice exam don't just test definitions. They present you with the same complex, scenario-based problems you'll encounter on the actual exam.
Strategic Weakness Identification: Each practice session reveals exactly where you stand. Discover which domains need more attention, before AWS Certified Machine Learning - Specialty exam day arrives.
Confidence Through Familiarity: There's no substitute for knowing what to expect. When you've worked through our comprehensive MLS-C01 practice exam questions pool covering all topics, the real exam feels like just another practice session.
Copyright © All Rights Reserved