During which phase of IKEv2 does the Diffie-Helman key exchange take place?
A. IKE_Req_INIT
B. Create_CHILD_SA
C. IKE_Auth
D. IKE_SA_INIT
Explanation:
In IKEv2, the protocol has a simplified exchange with defined phases and message exchanges:
1.IKE_SA_INIT Exchange (Messages 1 & 2): This is the initial exchange where the two peers:
Negotiate cryptographic algorithms (encryption, integrity, PRF, DH group).
Perform the Diffie-Hellman key exchange. The DH public values are exchanged in this phase.
Generate the keying material for the IKE SA (also called the "IKE_SA" or Phase 1 SA).
Provide nonces to protect against replay attacks.
2.IKE_AUTH Exchange (Messages 3 & 4): This exchange occurs under the protection of the SA established in IKE_SA_INIT. It is used for:
Mutual authentication (using certificates, PSK, etc.).
Establishing the first CHILD_SA (which often serves as the Phase 2/IPsec SA for data).
Exchanging identities and optionally configuration data (like virtual IP addresses).
The Create_CHILD_SA exchange is used later to establish additional CHILD_SAs (e.g., more IPsec tunnels for different traffic selectors) or to rekey the IKE_SA or existing CHILD_SAs. The DH exchange can optionally occur again here if new keying material is needed (e.g., using PFS - Perfect Forward Secrecy), but the initial and primary DH exchange always happens in IKE_SA_INIT.
Why the Other Options are Incorrect:
A. IKE_Req_INIT:
This is not a standard IKEv2 exchange name. It appears to be a distractor combining elements of the correct answer.
B. Create_CHILD_SA:
While a DH exchange can happen during a Create_CHILD_SA exchange (if PFS is requested for a new CHILD_SA or for rekeying), the question asks during which phase it takes place, implying the standard, initial exchange. The definitive, required DH exchange for establishing the IKE_SA always occurs in IKE_SA_INIT.
C. IKE_Auth:
The IKE_Auth exchange is protected by the keys already derived from the DH exchange done in IKE_SA_INIT. No DH key exchange occurs here; it's for authentication and the first CHILD_SA setup.
Reference:
IKEv2 RFC 7298: Defines the two-phase exchange: IKE_SA_INIT followed by IKE_AUTH.
Diffie-Hellman in IKEv2: The DH public values are carried in the Key Exchange payloads within the IKE_SA_INIT messages.
Exhibit.
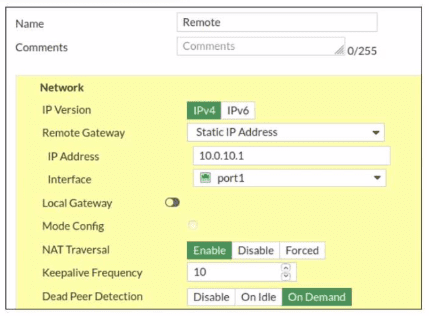
Refer to the exhibit, which contains a screenshot of some phase 1 settings.
The VPN is not up. To diagnose the issue, the administrator enters the following CLI
commands on an SSH session on FortiGate:
However, the IKE real-time debug does not show any output. Why?
A. The administrator must also run the command diagnose debug enable.
B. The debug shows only error messages. If there is no output, then the phase 1 and phase 2 configurations match.
C. The log-filter setting is incorrect. The VPN traffic does not match this filter.
D. Replace diagnose debug application ike -1 with diagnose debug application ipsec -1.
Explanation:
In FortiOS, enabling application-level debugging is a two-step process:
diagnose debug application ike -1 specifies what to debug (IKE) at the most verbose level.
diagnose debug enable globally activates debug output to the console.
Without step 2, no debug output is displayed. The administrator’s commands omitted this critical step, resulting in no visible debug messages.
Why the Other Options are Incorrect:
B: The -1 flag enables maximum verbosity, showing all negotiation steps—not just errors.
A matching configuration would still produce debug output showing successful handshake messages.
C: An incorrect log filter reduces output but doesn’t cause total silence.
If traffic didn’t match the filter, other IKE events (like incoming negotiation attempts) would still generate debug output if debugging were enabled.
D: Switching to IPsec debugging is inappropriate here.
The VPN is completely down, indicating a Phase 1 (IKE) problem. IPsec debugging shows Phase 2 details only after IKE succeeds. Moreover, this doesn’t address the missing diagnose debug enable command.
Reference:
FortiGate CLI troubleshooting methodology requires activating debug output with diagnose debug enable. This is documented in Fortinet’s debugging guides and is a fundamental step for FCSS NST certification.
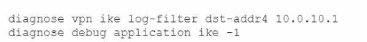
Refer to the exhibit.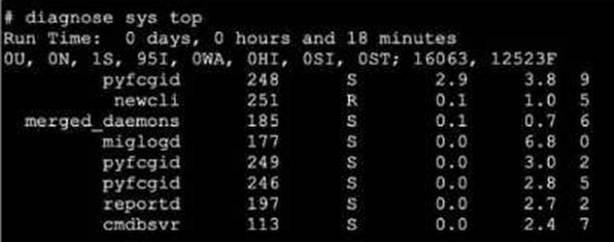
A. The miglogd daemon is running on CPU core ID 0.
B. The diagnose sys top command has been running for 18 minutes.
C. The miglogd daemon would be on top of the list, if the administrator pressed m on the keyboard.
D. The cmdbsvr process is occupying 2.4% of the total user memory space.
E. If the neweli daemon continues to be in the R state, it will need to be manually restarted.
Exhibit.
Refer to the exhibit, which shows the output of a diagnose command.
What can you conclude about the debug output in this scenario?
A. The first server provided to FortiGate when it performed a DNS query looking for a list of rating servers, was 121.111.236.179.
B. There is a natural correlation between the value in the FortiGuard-requests field and the value in the Weight field.
C. FortiGate used 64.26.151.37 as the initial server to validate its contract.
D. Servers with a negative TZ value are less preferred for rating requests.
Explanation:
The diagnose debug rating output displays the list of FortiGuard servers used for web filtering and other security services. The server 64.26.151.37 appears at the top of the list with a low RTT (45ms) and has processed 262,432 requests, which is a high number compared to others. This indicates it has been actively used. FortiGate devices contact a FortiGuard server first to validate their license/contract when the service is enabled. The server with the highest request count and prime position in the list is typically the initial validation server.
Why the Other Options are Incorrect:
A. The IP 121.111.236.179 does not appear in the server list provided. The output shows entirely different IPs. This option is fabricated.
B. There is no correlation between the Weight field and the FortiGuard-requests field. Weight is a static priority value assigned to each server (e.g., 10 or 20), while request counts are dynamic and based on actual usage. Servers with weight 10 have both high and low request counts.
D. The TZ (Time Zone) field does not influence server preference. Preference is determined by a combination of Weight (priority), RTT (latency), and flags. The flags column shows statuses like D (down) or DI (down and initial connection failed), which affect selection, but TZ is purely informational.
Reference:
FortiOS uses FortiGuard servers for real-time security services. The command diagnose debug rating shows server selection metrics. The initial contract validation occurs with the first responsive server, often the one with the lowest RTT and highest weight.
Which statement about parallel path processing is correct (PPP)?
A. PPP chooses from a group of parallel options lo identity the optimal path tor processing a packet.
B. Only FortiGate hardware configurations affect the path that a packet takes.
C. PPP does not apply to packets that are part of an already established session.
D. Software configuration has no impact on PPP.
Explanation:
Parallel Path Processing (PPP) is a FortiOS mechanism that evaluates multiple processing paths in parallel to determine the most efficient route for handling a packet. It uses firewall policy configuration and UTM/NGFW feature sets to decide how traffic should be processed — whether through fast-path offloading (via CP processors) or deep inspection paths.
PPP is triggered during the first packet of a session, where FortiOS evaluates all applicable paths (e.g., IPS, AV, DLP, App Control) and selects the optimal one based on policy and hardware acceleration availability.
Once a session is established, subsequent packets follow the chosen path, meaning PPP is not re-evaluated for those packets.
❌ Why the other options fail:
B. Only FortiGate hardware configurations affect the path:
Incorrect. While hardware (CP8/CP9) influences acceleration, software configuration (firewall policies, UTM profiles) directly determines which path PPP selects.
C. PPP does not apply to packets that are part of an already established session:
Technically true, but misleading. PPP does apply to the first packet, which is the critical decision point. This option is a distractor.
D. Software configuration has no impact on PPP:
False. Firewall policies and UTM settings are central to PPP, as they define which inspection engines are invoked.
📖 Reference:
Fortinet Docs –
Parallel Path Processing (Life of a Packet)
Exhibit.
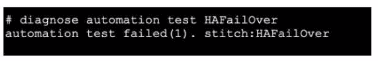
Refer to the exhibit, which shows the output of diagnose automation test.
What can you observe from the output? (Choose two.)
A. The automation stitch test is not being logged.
B. The automation stitch test failed but the HA failover was successful.
C. An HA failover occurred.
D. The test was unsuccessful.
Explanation:
The output shows the diagnostic command diagnose automation test HAFailover returned the result automation test failed(1). This indicates the automation stitch test itself failed to execute properly. Furthermore, the diagnostic output does not show any subsequent log messages that would normally be generated by a successful stitch execution. Therefore, the test was unsuccessful, and the stitch is not being logged due to the failure.
Why the Other Options are Incorrect:
B. The automation stitch test failed but the HA failover was successful.
This is incorrect. The diagnostic command only tests the automation stitch named "HAFailover". It does not trigger, monitor, or confirm an actual HA failover event. The output explicitly states the test failed; it makes no statement about the success of a real failover.
C. An HA failover occurred.
This is false. The diagnose automation test command is a troubleshooting tool to validate the logic and triggering of an automation stitch configuration. It simulates the stitch's conditions and actions in a test environment. It does not execute the actual actions (like forcing an HA failover). No failover occurred.
Reference:
FortiOS Automation Stitches:
These are configured triggers and actions. The diagnose automation test
What are two functions of automation stitches? (Choose two.)
A. You can configure automation stitches on any FortiGate device in a Security Fabric environment.
B. You can configure automation stitches to execute actions sequentially by taking parameters from previous actions as input for the current action.
C. You can set an automation stitch configured to execute actions in parallel to insert a specific delay between actions.
D. You can create automation stitches to run diagnostic commands and attach the results to an email message when CPU or memory usage exceeds specified thresholds.
Explanation:
B. Automation stitches support sequential action execution where the output (parameters) from one action can be used as input for the next action. This is achieved using variables (like %%log.time%% or %%results%%) that capture data from a previous step, enabling complex workflows.
D. This describes a primary use case. An automation stitch can be triggered by a CLI script action (e.g., diagnose sys top) and an email action to send the results. The trigger condition can be based on system metrics like high CPU/memory, defined via a System Threshold Monitor or event-based trigger.
Why the Other Options are Incorrect:
A. Automation stitches are configured on the FortiGate Manager (FMG) or locally on a standalone FortiGate. They are not configurable on "any FortiGate device in a Security Fabric environment" unless that device is the FMG or the primary Fabric root.
C. Automation stitches configured for parallel execution run all actions simultaneously when triggered. You cannot insert a specific delay between actions in parallel mode. Delays (pause action) are only available in sequential mode to control timing between steps.
Reference:
FortiOS Automation Guide – Stitches can run actions sequentially with variable passing and are triggered by events (logs, thresholds). They integrate CLI diagnostics with notification actions like email.
Refer to the exhibit, which shows the output of get router info bgp summary.
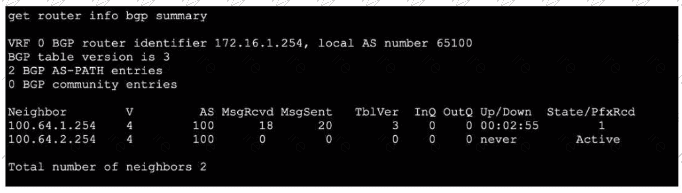
Which two statements are true? (Choose two.)
A. The local ForliGate has received one prefix from BGP neighbor 100.64.1.254.
B. The TCP connection with BGP neighbor 100.64.2.254 was successful.
C. The local FortiGate has received 18 packets from a BGP neighbor.
D. The local FortiGate is still calculating the prefixes received from BGP neighbor 100.64.2.264
Explanation:
A.The column State/PfxRcd shows the number of prefixes received from each neighbor. For neighbor 100.64.1.254, the value is 1, indicating one BGP route (prefix) has been accepted and installed in the routing table.
C. The column MsgRcvd shows the total number of BGP messages received from each neighbor since the session started. For neighbor 100.64.1.254, the value is 18 BGP packets (which include KEEPALIVE, UPDATE, NOTIFICATION, and OPEN messages).
Why the Other Options are Incorrect:
B. The TCP connection with neighbor 100.64.2.254 was NOT successful.
The State is shown as Active, which means the FortiGate is attempting to establish a TCP connection (or a BGP session) but has not succeeded. A successful session would show a numeric prefix count and an Up/Down time (like 00:02:55), not Active.
D. This is incorrect for two reasons.
First, the neighbor IP is wrong (100.64.2.264 vs. the actual 100.64.2.254 in the output). Second, the neighbor 100.64.2.254 is in Active state, meaning no BGP session exists, so there are no prefixes to calculate. The FortiGate is not calculating prefixes; it is stuck trying to establish the initial TCP connection.
Reference:
FortiOS BGP monitoring. In get router info bgp summary:
State/PfxRcd: Shows session state and prefixes received (a number means established; Active means trying to connect).
MsgRcvd: Total BGP messages received from that neighbor.
Up/Down: Session duration; never means never established.
Refer to the exhibit, which shows the partial output of a diagnose command.
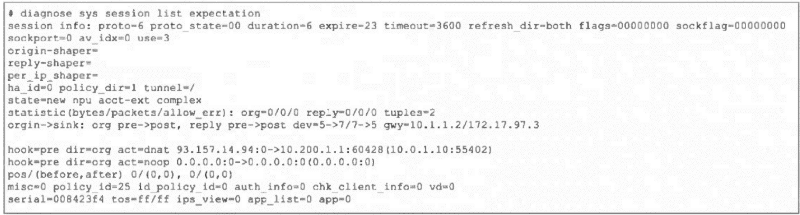 Which two conclusions can you draw from the output shown in the exhibit? (Choose two.)
A. FortiGate will drop the expected traffic if it does not arrive within 23 seconds.
B. Clearing the master session has no impact on the expectation session.
C. This is a pinhole session to allow traffic for a TCP protocol that dynamically assigns TCP ports.
D. The session is checked against firewall policy ID 25.
Explanation:
A. The expire=23 field indicates this is a session expectation (a temporary pinhole) that will be removed if the expected return traffic is not seen within 23 seconds. This is a security measure to close dynamic pinholes if the anticipated traffic doesn't arrive.
C. The state=new npu acct-ext complex and proto_state=00 with expire timer are classic indicators of a session expectation created for protocols that use dynamic ports (like FTP, SIP, or certain gaming protocols). The firewall creates this placeholder/pinhole to allow the expected return traffic, which will match this expectation and spawn a new data session.
Why the Other Options are Incorrect:
B. Clearing the master session does impact the expectation session.
Expectations are dependent on the parent session that created them (e.g., the FTP control session). If the master session is cleared (terminated), its associated expectations are also removed because the pinhole is no longer needed.
D. The session is not checked against firewall policy ID 25.
The field policy_id=25 is the policy ID of the parent/master session that triggered this expectation. The expectation session itself bypasses policy check (hook=pre dir=org act=chat shows it's handled pre-policy by the kernel). Traffic matching this expectation will be allowed without re-evaluating policy ID 25.
Reference:
FortiOS Session Helpers and Expectations. In diagnose sys session list output:
expire: Timer for expectation sessions.
state=...complex: Indicates a helper-created expectation.
hook=pre dir=org act=chat: Shows the session is processed in the kernel pre-policy for ALG/helper traffic.
Refer to the exhibit, which shows a partial output from the get router info routing-table
database command.
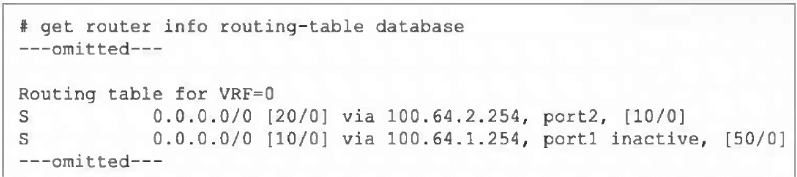
The administrator wants to configure a default static route for port3 and assign a distance
of 50 and a priority of 0.
What will happen to the port1 and port2 default static routes after the port3 default static
route is created?
A. The port2 default static route will be injected into the forwarding information base (FIB).
B. The port1 default static route will be injected into the FIB.
C. Neither of the routes shown in the output will be injected into the FIB.
D. Both default static routes shown in the output will be injected into the FIB.
Explanation:
The output shows two existing default static routes (0.0.0.0/0):
Via port2, distance 20, administrative distance 10, no priority set [10/0].
Via port1, distance 10, administrative distance 50, marked inactive, priority 0 [50/0].
The active route in the FIB is chosen based on:
Lowest distance (primary metric).
If distances are equal, then lowest administrative distance.
If both are equal, then highest priority (ECMP).
Currently, the port2 route has distance 20, which is higher (worse) than the port1 route's distance 10. However, the port1 route is inactive, meaning it is not eligible for the FIB, so port2 is installed as the active default route.
Adding a new default route via port3 with distance 50 and priority 0 will have a higher (worse) distance than both existing routes. Therefore, it will not become the active route. Since the port1 route remains inactive, the port2 route (distance 20) will remain the best valid route and will stay injected into the FIB.
Why the Other Options are Incorrect:
B. The port1 route is inactive, so it cannot be injected into the FIB regardless of its distance or priority.
C. The port2 route is currently active and will remain active because the new route has a worse distance (50) and the port1 route is inactive.
D.Only one default route can be active in the FIB at a time for a given destination (ECMP is an exception with equal distances). The port1 route is inactive, so only port2 can be injected.
Reference:
FortiOS routing selection algorithm:
Distance → Administrative Distance → Priority. An inactive route is excluded from consideration. The command get router info routing-table database shows all routes in the RIB, while get router info routing-table all shows only active FIB routes.
Which authentication option can you not configure under config user radius on FortiOS?
A. mschap
B. pap
C. mschap2
D. eap
Explanation:
When configuring RADIUS authentication on FortiOS using the CLI (config user radius), the supported authentication types are PAP, MSCHAP, and MSCHAPv2. These are explicitly selectable under the set auth-type command. FortiOS does not allow configuration of EAP (Extensible Authentication Protocol) in this context. EAP is primarily used in wireless authentication scenarios such as 802.1X with WPA2-Enterprise, and FortiGate devices rely on FortiAuthenticator or external RADIUS servers to handle EAP methods. Therefore, within FortiOS itself, EAP is not a valid option under config user radius.
A. mschap
→ Supported. MSCHAP is a challenge-response protocol used for RADIUS authentication. It is weaker than MSCHAPv2 but still available in FortiOS.
B. pap
→ Supported. PAP is the simplest form of RADIUS authentication, transmitting credentials in clear text. While insecure, it is often used for compatibility with legacy systems.
C. mschap2
→ Supported as MSCHAPv2. This is the stronger variant of MSCHAP, offering improved security and widely used in RADIUS environments.
D. eap
→ Not supported. FortiOS does not provide EAP configuration under config user radius. EAP methods must be handled by FortiAuthenticator or external RADIUS servers, not directly by FortiGate.
Thus, the correct answer is EAP, because FortiOS restricts RADIUS authentication types to PAP, MSCHAP, and MSCHAPv2 only. This distinction is important in exam scenarios because EAP is often confused as a possible option due to its common use in enterprise wireless authentication, but it is not configurable within FortiOS RADIUS settings.
📖References:
FortiOS CLI Reference Guide 7.6 – User RADIUS Configuration (set auth-type {pap | chap | mschap | mschapv2})
Which two statements are true regarding heartbeat messages sent from an FSSO collector agent to FortiGate? (Choose two.)
A. The heartbeat messages can be seen using the command diagnose debug authd fsso list.
B. The heartbeat messages can be seen in the collector agent logs.
C. The heartbeat messages can be seen on FortiGate using the real-lime FSSO debug.
D. The heartbeat messages must be manually enabled on FortiGate.
Explanation:
A. The diagnose debug authd fsso list command displays real-time communication events between the FortiGate and FSSO Collector Agents, including heartbeat messages (typically logged as periodic "poll" or "keepalive" events). This is the primary method to monitor agent connectivity.
C. The "real-time FSSO debug" refers to the same output generated by diagnose debug authd fsso list (usually enabled via diagnose debug enable). Heartbeat exchanges are visible here, showing the active status of each agent.
Why the Other Options are Incorrect:
B. Heartbeat messages are sent from the Collector Agent to the FortiGate.
While the agent logs may show its own activity, the heartbeat messages themselves (the network packets) are not logged in detail on the agent side. The agent logs focus on user authentication events and service status, not the low-level heartbeat packets.
D. Heartbeats are automatically enabled when FSSO is configured.
No manual activation is required. The heartbeat interval is configurable (default is 5 minutes), but the feature itself is always active once an agent is defined on the FortiGate.
Reference:
FSSO architecture documentation states that Collector Agents send periodic heartbeats to the FortiGate to confirm connectivity. These are monitored via FortiGate debug commands (diagnose debug authd fsso list) to troubleshoot agent communication issues.
| Page 2 out of 6 Pages |
| Previous |