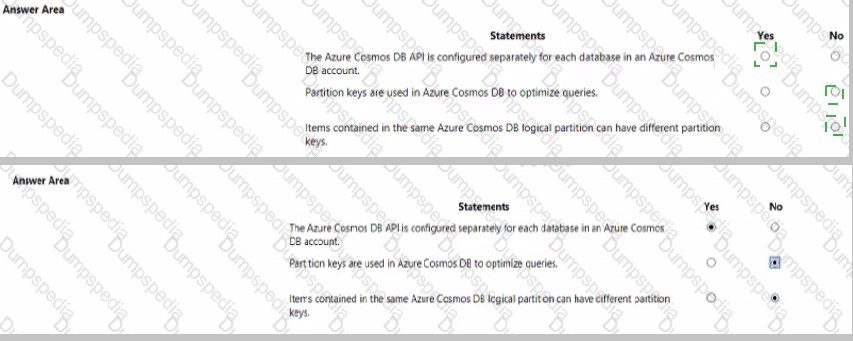
For each of the following statements. select Yes if the statement is true. Otherwise, select No. NOTE Each correct selection is worth one point.
Explanation:
This question tests fundamental knowledge of Azure Cosmos DB account structure and partitioning. It requires understanding that the API is set at the account level, not per database, and that the primary purpose of a partition key is scalable data distribution, not query optimization.
Correct Option:
First Statement, Select "No":
The API for Azure Cosmos DB (e.g., SQL, MongoDB, Cassandra) is a core property defined when creating the account. All databases and containers within that account use the same API. You cannot configure a different API for individual databases inside a single account.
Second Statement, Select "Yes":
Partition keys are fundamental for horizontal scalability (partitioning) by logically grouping data. While a well-chosen partition key can improve query performance for operations scoped to a single partition, its primary and defining function is to enable scalable storage and throughput distribution, which indirectly optimizes the data architecture for queries.
Incorrect Option:
First Statement, Selecting "Yes":
This is incorrect because it misstates a core architectural concept. An Azure Cosmos DB account is created for a specific API model, which then applies universally to all its child resources (databases, containers). Creating separate APIs per database would require separate Cosmos DB accounts.
Second Statement, Selecting "No":
This is incorrect because it underestimates the role of the partition key. Although not a direct query tuning tool like an index, the partition key's design is crucial for query efficiency. Queries filtered on the partition key are highly efficient and cost-effective, making it a key factor in query optimization strategy.
Reference:
Microsoft Learn: "Choose the appropriate API for Azure Cosmos DB" and "Partitioning and horizontal scaling in Azure Cosmos DB".
What are two uses of data visualization? Each correct answer present a complete solution.
NOTE: Each correct selection is worth one point.
A. Represent trends and patterns over time.
B. Communicate the significance of data.
C. implement machine learning to predict future values.
D. Consistently implement business logic across reports
Explanation:
This question asks for the primary purposes of data visualization. It is a core concept about transforming raw data into graphical formats to make information more accessible, understandable, and usable for human decision-makers.
Correct Option:
A. Represent trends and patterns over time:
This is a fundamental use. Visualizations like line charts, area charts, and timelines are specifically designed to show how metrics change over a period, making trends, cycles, and patterns immediately apparent, which is difficult to see in raw tables of numbers.
B. Communicate the significance of data:
This is the overarching goal of visualization. By using elements like color, size, position, and chart type, visualizations highlight key insights, outliers, correlations, and proportions, effectively telling a story about what the data means and why it matters to the audience.
Incorrect Option:
C. Implement machine learning to predict future values:
This is incorrect. Data visualization is a tool for presenting and exploring data, including the results of machine learning models (like forecast lines). However, the actual implementation and training of ML algorithms to make predictions is a separate, backend analytical process, not a function of the visualization itself.
D. Consistently implement business logic across reports:
This is incorrect. While visualization tools can apply consistent business logic (like calculated measures or filters), ensuring this consistency is a function of data modeling, governance, and report design rules. The visualization is the output layer that displays the results of that logic, not the mechanism that implements it.
Reference:
Microsoft Learn: "Describe data visualization" (DP-900 learning path). The module describes visualization as a way to tell a story from data, highlight trends or patterns, and communicate insights effectively.
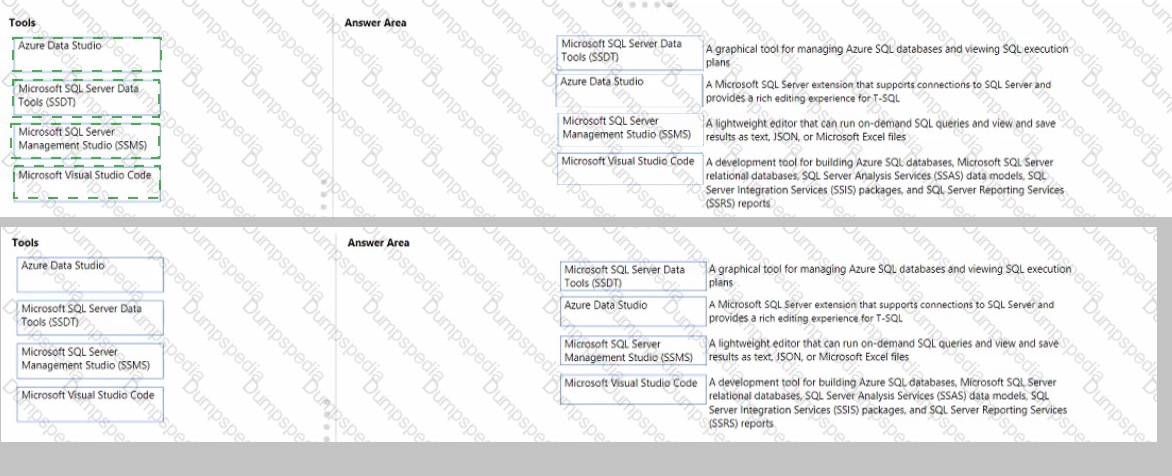
Match the tools to the appropriate descriptions.
To answer, drag the appropriate tool from the column on the left to its description on the right. Each tool may be used once, more than once, or not at all.
NOTE: Each correct match is worth one point
Explanation:
This question tests knowledge of various Microsoft data tools and their primary use cases. It requires matching each graphical description to the specific tool designed for that primary function, focusing on database management, development, and querying.
Correct Option:
A graphical tool for managing Azure SQL databases and viewing SQL execution plans. → Microsoft SQL Server Management Studio (SSMS):
SSMS is the comprehensive, flagship management tool for SQL Server and Azure SQL Database. It provides a full graphical interface for administrative tasks, object management, query writing, and crucially, for viewing and analyzing graphical execution plans to optimize query performance.
A Microsoft SQL Server extension that supports connections to SQL Server and provides a rich editing experience for T-SQL. → Microsoft Visual Studio Code:
This describes the "SQL Server (mssql)" extension for VS Code. VS Code is a lightweight, cross-platform code editor that, with this extension installed, gains robust features for connecting to SQL Server, IntelliSense for T-SQL, and snippet support, making it a powerful tool for developers.
A lightweight editor that can run on-demand SQL queries and view and save results as text, JSON, or Microsoft Excel files. → Azure Data Studio:
Azure Data Studio is explicitly designed as a lightweight, cross-platform tool for data professionals. Its core features include running on-demand queries, notebooks, and flexible result-set viewing with export options to text, JSON, CSV, and Excel, differentiating it from the heavier SSMS.
A development tool for building Azure SQL databases... (SSAS, SSIS, SSRS)... → Microsoft SQL Server Data Tools (SSDT):
SSDT is the dedicated integrated development environment (IDE) within Visual Studio for building the entire suite of SQL Server data solutions. It provides project templates and designers specifically for databases, Analysis Services models, Integration Services packages, and Reporting Services reports.
Incorrect Option:
There are no unmatched or incorrect pairings in this scenario, as each description has one distinct, correct tool. Using a tool for a different description would be incorrect. For example, dragging SSMS to the "lightweight editor" description would be wrong, as SSMS is a comprehensive management suite, not a lightweight tool. Dragging Azure Data Studio to the "development tool for building SSIS packages" would be incorrect, as that is the specific domain of SSDT within Visual Studio.
Reference:
Microsoft Learn: "Describe data roles and services - Describe data visualization tools" and documentation for each tool (e.g., "What is Azure Data Studio?", "SQL Server Management Studio (SSMS)", "SQL Server Data Tools (SSDT)").
To complete the sentence, select the appropriate option in the answer area.

Explanation:
This question tests knowledge of specific Power BI artifact types and their primary use cases. It requires distinguishing between a report, a dashboard, and a subscription based on the description of creating formatted, fixed-layout documents for archival purposes.
Correct Option:
A Microsoft Power BI report enables users to create highly formatted, fixed-layout documents or organized reports for archiving.
This is correct. While Power BI reports are typically interactive, a key feature is the ability to export report pages to static, fixed-layout formats like PDF or PowerPoint. This "pixel-perfect" export functionality is specifically designed for creating formatted documents for printing, sharing, and archival, which matches the description perfectly.
Incorrect Option:
Dashboard:
A Power BI dashboard is a single canvas that displays visualizations and key metrics from underlying reports. It is designed for high-level, real-time monitoring and interaction, not for creating formatted, multi-page documents for archiving. You cannot export a dashboard to a structured document like a PDF in the same way you can with a report.
Subscription:
A subscription is a feature that automatically delivers a snapshot of a report page or dashboard via email at scheduled intervals. It is a method of distributing content, not a type of artifact used to create formatted documents. The subscription itself does not enable the creation of the document; it sends an existing report.
Reference:
Microsoft Learn: "Distribute and share content in Power BI" and specifically, the documentation on exporting reports to PDF. The learning path describes Power BI reports as the tool for creating organized, paginated content that can be exported for fixed-format sharing.
You have a SQL query that combines customer data and order data. The query includes calculated columns.
You need to persist the SQL query so that other users can use the query. What should you create?
A. a table
B. an index
C. scalar function
D. a view
Explanation:
This question tests knowledge of database objects and their purposes. The core requirement is to save a defined SQL query (including joins and calculations) as a reusable, virtual object that other users can query directly, without storing the result data physically.
Correct Option:
D. a view:
A view is the correct object for this scenario. It acts as a saved, virtual table defined by a SELECT query. The query (including joins, filters, and calculated columns) is stored in the database. When users query the view, the stored query runs against the underlying tables, returning the latest data. This provides reusability, security, and simplification without duplicating data.
Incorrect Option:
A. a table:
Creating a table would materialize the results of the query at a single point in time. This creates data redundancy, and the information would become stale as the underlying customer and order tables change. It does not persist the query logic for dynamic, on-demand use.
B. an index:
An index is a performance-tuning structure that speeds up data retrieval from tables but does not store query logic or make it available to users. It cannot be queried directly by users; it works transparently behind the scenes to optimize queries on tables or views.
C. scalar function:
A scalar function returns a single value and is used within SELECT statements, typically to encapsulate a calculation. It cannot store an entire query involving multiple tables, joins, and multiple columns. It is meant for computations, not for persisting a complete dataset query for user access.
Reference:
Microsoft Learn: "Describe data roles and services - Describe database objects". The module explains that a view is a virtual table whose contents are defined by a query, allowing users to work with data as if it were a table.
To complete the sentence, select the appropriate option in the answer area.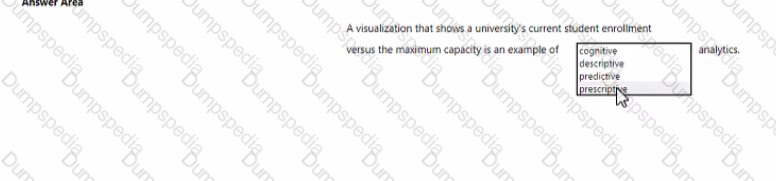
Explanation:
This question tests the understanding of the four core types of data analytics. It requires classifying an analytics example based on its purpose: describing what has happened or is happening versus making predictions or recommendations for the future.
Correct Option:
Descriptive analytics:
A visualization comparing current enrollment to capacity is a classic example of descriptive analytics. This category answers the question "What happened?" or "What is happening?" by summarizing historical or current-state data to provide insight into past performance or present conditions. It describes the situation using reports, dashboards, and visualizations without predicting or prescribing action.
Incorrect Option:
Cognitive analytics:
This is not one of the four standard, fundamental types of analytics (Descriptive, Diagnostic, Predictive, Prescriptive). "Cognitive" generally refers to systems that mimic human thought (like AI), and while it uses analytics, it is not the correct classification for this basic reporting scenario.
Predictive analytics:
This type forecasts what will happen in the future based on historical data (e.g., predicting next semester's enrollment). The given example only shows the current state versus a target, not a future outcome, so it is not predictive.
Prescriptive analytics:
This type suggests actions to take to affect future outcomes (e.g., recommending strategies to increase enrollment). The visualization only describes the current situation; it does not provide recommendations on what to do about it, so it is not prescriptive.
Reference:
Microsoft Learn: "Describe data analytics core concepts - Describe types of data analysis". The module defines descriptive analytics as the process of summarizing historical data to identify patterns and trends, typically through reporting and visualization.
To complete the sentence, select the appropriate option in the answer area.
Explanation:
This question tests understanding of the strengths and weaknesses of relational databases versus other database types, like non-relational (NoSQL) databases. The scenario describes several complex, high-scale, and flexible write patterns that are challenging for traditional relational models.
Correct Option:
No: This statement is false. A relational database, with its rigid schema, ACID transactions, and single-writer master models, is generally not the best fit for the described scenario. High volume of relationship changes, geographically distributed writes, and varying data structures are key strengths of non-relational databases (like Azure Cosmos DB) designed for massive scale, flexibility, and global distribution. Relational databases prioritize structured data, strong consistency, and complex queries over this type of write flexibility and geographic scale.
Incorrect Option:
Yes: This is incorrect. Selecting "Yes" would mean that a relational database is well-suited for these requirements, which is not accurate. While relational databases excel at transactional integrity and complex queries on structured data, they typically struggle with:
Varying data structures: They require a fixed schema, making agile changes difficult.
Geographically distributed writes: They are often architected for a primary write region to maintain consistency, complicating multi-region write scenarios.
Extremely high-volume relationship changes: This can create locking and performance bottlenecks in normalized tables.
Reference:
Microsoft Learn: "Describe types of data workloads - Describe transaction processing workloads" and "Describe analytics workloads". The learning paths contrast relational (OLTP) systems, optimized for structured, consistent transactions, with non-relational systems designed for scalability and flexible schemas, which align with the challenges described.
You have a table named Sales that contains the following data.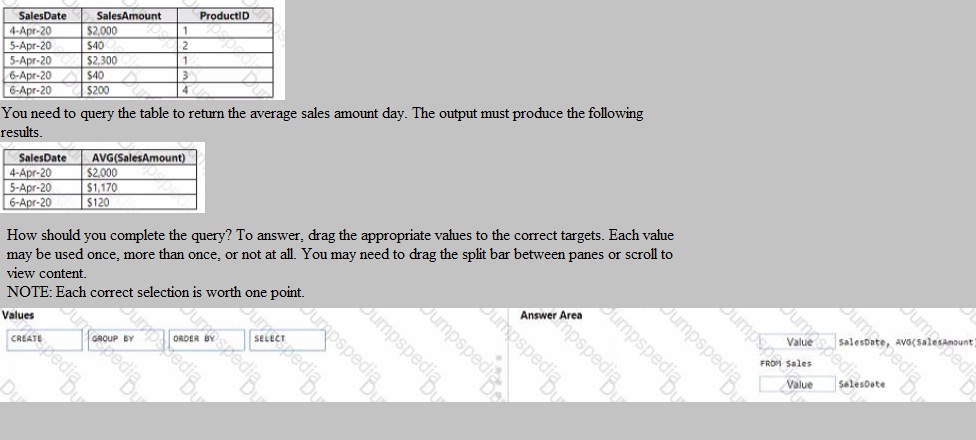
Explanation:
This question tests knowledge of the basic structure of a SQL SELECT query used for aggregation. To calculate an average per day, you must group the rows by the SalesDate column. The required output shows a single average amount for each date, confirming the need for a GROUP BY clause.
Correct Option:
The completed query must be:
SELECT SalesDate, AVG(SalesAmount)
This specifies the columns to return: the date and the calculated daily average.
FROM Sales
This specifies the source table.
GROUP BY SalesDate
This is the critical clause. It instructs the database to aggregate (calculate the AVG) for all rows that share the same SalesDate, producing one result row per unique date.
The ORDER BY clause is not required by the question, as the provided output does not specify a sort order. The values must be dragged to the corresponding clauses in the answer area.
Incorrect Option:
Using ORDER BY SalesDate instead of GROUP BY:
This would simply sort the raw data by date without performing any aggregation. The result would still show all five original rows, sorted, not the three averaged rows shown in the required output.
Using CREATE:
This is a Data Definition Language (DDL) keyword for creating objects (like tables or views), not for querying data. It has no place in this SELECT query.
Placing AVG(SalesAmount) in the GROUP BY clause:
The GROUP BY clause can only contain columns used for grouping, not aggregate functions like AVG. Aggregate functions belong in the SELECT clause.
Reference:
Microsoft Learn: "Describe data roles and services - Describe database objects" in the context of querying with T-SQL, specifically the use of the GROUP BY clause to aggregate data.
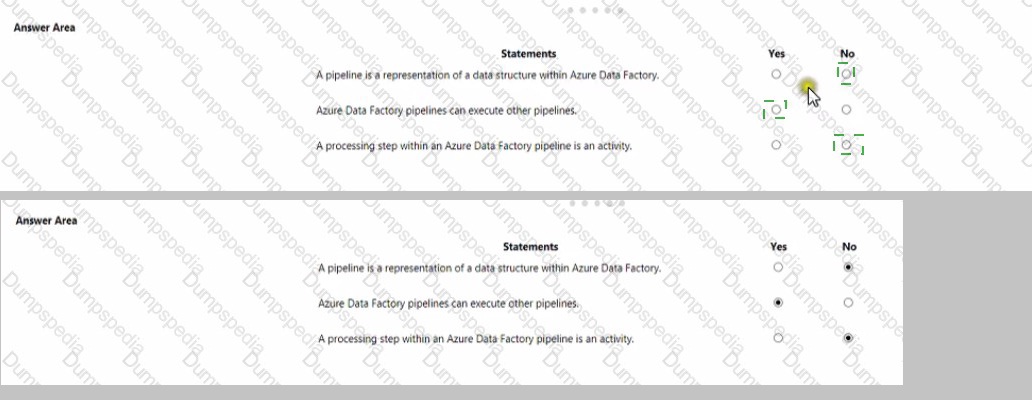
For each of the following statements, select Yes if the statement is true. Otherwise select No.
NOTE: Each correct selection is worth one point.
Explanation:
This question tests fundamental knowledge of Azure Data Factory (ADF) core concepts. It requires understanding the definition of a pipeline, its capabilities, and its internal components according to the Azure Data Factory service.
Correct Option:
First Statement, Select "No":
A pipeline is not a representation of a data structure. In Azure Data Factory, a pipeline is a logical grouping of activities that together perform a data engineering task (like copy, transform, control flow). Data structures are defined by datasets.
Second Statement, Select "Yes":
Azure Data Factory pipelines can execute other pipelines. This is achieved using the Execute Pipeline activity, which allows for modular design, reuse, and orchestration of complex workflows by chaining pipelines together.
Third Statement, Select "Yes":
This statement is precisely accurate. An activity defines a single processing step or action (like Copy data, Execute a Databricks notebook, or an If Condition) within a pipeline. A pipeline is a container for one or more activities.
Incorrect Option:
First Statement, Selecting "Yes":
This is incorrect because it confuses a pipeline with a dataset. A dataset is the named view of data that points to or references the data you want to use in your activities, defining its structure.
Second Statement, Selecting "No":
This is incorrect as it denies a core orchestration feature. The Execute Pipeline activity is a fundamental control flow activity in ADF, enabling pipeline composition and complex workflow management.
Third Statement, Selecting "No":
This is incorrect because it contradicts the official ADF documentation and architecture. Activities are the fundamental units of work inside a pipeline; without activities, a pipeline would perform no actions.
Reference:
Microsoft Learn: "Describe data ingestion and processing on Azure - Describe data processing with Azure Data Factory". The module explicitly defines pipelines, activities, and datasets, and details the use of the Execute Pipeline activity.
Which Azure storage solution provides native support for POSIX-compliant access control lists (ACLs)?
A. Azure Queue storage
B. Azure Data Lake Storage
C. Azure table storage
D. Azure Files
Explanation:
This question tests knowledge of specific Azure storage services and their native support for file system-level security features, specifically POSIX-compliant Access Control Lists (ACLs). ACLs provide granular permissions (read, write, execute) for users and groups on directories and files, a standard feature in Linux/Unix file systems.
Correct Option:
B. Azure Data Lake Storage Gen2:
This is the correct answer. Azure Data Lake Storage Gen2 (built on Azure Blob Storage) is explicitly designed for big data analytics workloads and provides a hierarchical namespace. A core feature of this service is native support for POSIX-compliant ACLs, enabling fine-grained access control down to the file and directory level, which is essential for managing security in large-scale analytical data repositories.
Incorrect Option:
A. Azure Queue storage:
This service is for messaging and queuing between application components. It does not deal with file system concepts like directories, files, or POSIX permissions. Its access control is managed via account keys or shared access signatures (SAS).
C. Azure table storage:
This is a NoSQL key-value store for semi-structured data. It uses a schema-less design with tables, rows, and partition/row keys. It does not support a hierarchical file system or POSIX ACLs; authentication is via account keys or SAS.
D. Azure Files:
While Azure Files provides SMB-based file shares and supports Windows-style ACLs (NTFS permissions) when mounted by Windows machines, it does not natively support POSIX-compliant ACLs as a core feature of the service in the same way ADLS Gen2 does for Hadoop/analytic ecosystems.
Reference:
Microsoft Learn: "Describe data storage on Azure - Describe Azure Data Lake Storage". The documentation for Azure Data Lake Storage Gen2 explicitly highlights its support for POSIX permissions and ACLs as a key feature for securing data in analytics scenarios.
A bar chart showing year-to date sales by region is an example of which type of analytics?
A. descriptive
B. diagnostic
C. predictive
D. prescriptive
Explanation:
This question tests knowledge of the four core types of data analytics by classifying a specific example. A bar chart showing year-to-date sales by region is a summary of what has happened up to the current point in time, which is the defining characteristic of a specific analytical category.
Correct Option:
A. Descriptive:
This is correct. Descriptive analytics answers the question "What happened?" by summarizing historical or current data to show patterns and trends. A bar chart visualizing year-to-date sales by region is a classic descriptive output. It aggregates and presents past performance data in an understandable format without explaining causes (diagnostic), forecasting (predictive), or suggesting actions (prescriptive).
Incorrect Option:
B. Diagnostic:
Diagnostic analytics goes deeper to answer "Why did it happen?" It involves drilling down into descriptive data, using techniques like correlation or drill-through to find root causes. A simple bar chart showing sales figures describes the what, not the why.
C. Predictive:
Predictive analytics uses historical data to forecast "What is likely to happen in the future?" (e.g., predicting next quarter's sales). The provided chart shows only past/current data, not a future projection.
D. Prescriptive:
Prescriptive analytics recommends actions to take to affect desired outcomes, answering "What should we do?" It often uses optimization or simulation models. A static bar chart does not provide recommendations or decision options.
Reference:
Microsoft Learn: "Describe data analytics core concepts - Describe types of data analysis". The module defines descriptive analytics as the process of describing or summarizing historical data to identify patterns, trends, and insights, typically through reporting and visualization.
For each of the following statements, select yes if the statement is true, Otherwise, select No.
Note: Each correct selection is worth one point.
Explanation:
This question tests the understanding of batch processing's capabilities regarding output destinations. Batch processing involves processing large volumes of data at rest in scheduled jobs. The key concept is that it is agnostic to the final storage technology; it can write transformed or aggregated results to various data stores based on business needs.
Correct Option:
All Statements, Select "Yes":
All three statements are true. Batch processing is a method of computation, not a storage technology. Therefore, it can output its processed results to virtually any persistent storage system.
File store:
A very common output (e.g., CSV, Parquet files in Azure Data Lake Storage or blob storage).
Relational database:
Processed data is often loaded into a data warehouse (like Azure Synapse Analytics) or operational database for reporting.
NoSQL database:
Results can be written to services like Azure Cosmos DB for application use or further analysis.
Incorrect Option:
There is no "No" selection for any statement, as all are correct. Selecting "No" for any would be incorrect because it would imply a technological limitation of batch processing that does not exist. The output destination is determined by the design of the batch job's final step (e.g., a "Copy Data" or "Write" activity), not by the batch processing paradigm itself.
Reference:
Microsoft Learn: "Describe data processing in Azure - Describe batch processing". The module explains that batch processing operates over large, static datasets and its results are stored for further use, implying flexibility in choosing the destination storage service.
| Page 1 out of 9 Pages |