An analyst needs to determine the appropriate data type for the following sample data:
sample data collected:
Which of the following data types should be used for this data?
A. Text
B. Float
C. Alphanumeric
D. Numeric
A data analyst is using a two-tailed, independent t-test to determine whether the type of stretching, dynamic or static, has any influence on a dancer's flexibility. Which of the following is the alternative hypothesis?
A. A dancer's flexibility is improved through static stretching.
B. The change in a dancer's flexibility is not equal to zero.
C. There is a difference in a dancer's flexibility between static and dynamic stretching.
D. The means of the static and dynamic stretching groups do not differ from each other.
An analyst is working on a project for a director. During this process. the analyst pulled the data. created summarized tables and graphs with descriptions, created a report summary, and inserted all items into a report. After writing the report, which of the following would be the most appropriate next step?
A. Complete an audit on the data pulled for the report.
B. Complete a check for quality in the report.
C. Complete a review of the data and a check for consistency
D. Complete a trend analysis to be included in the report.
A data analyst is attempting to understand how ice cream consumption is affected by different attributes. such as cost, temperature. and income level. Which of the following regression analyses should the data analyst perform to understand this relationship?
A. Logistic
B. Ordinary least squares
C. Cox
D. Polynomial
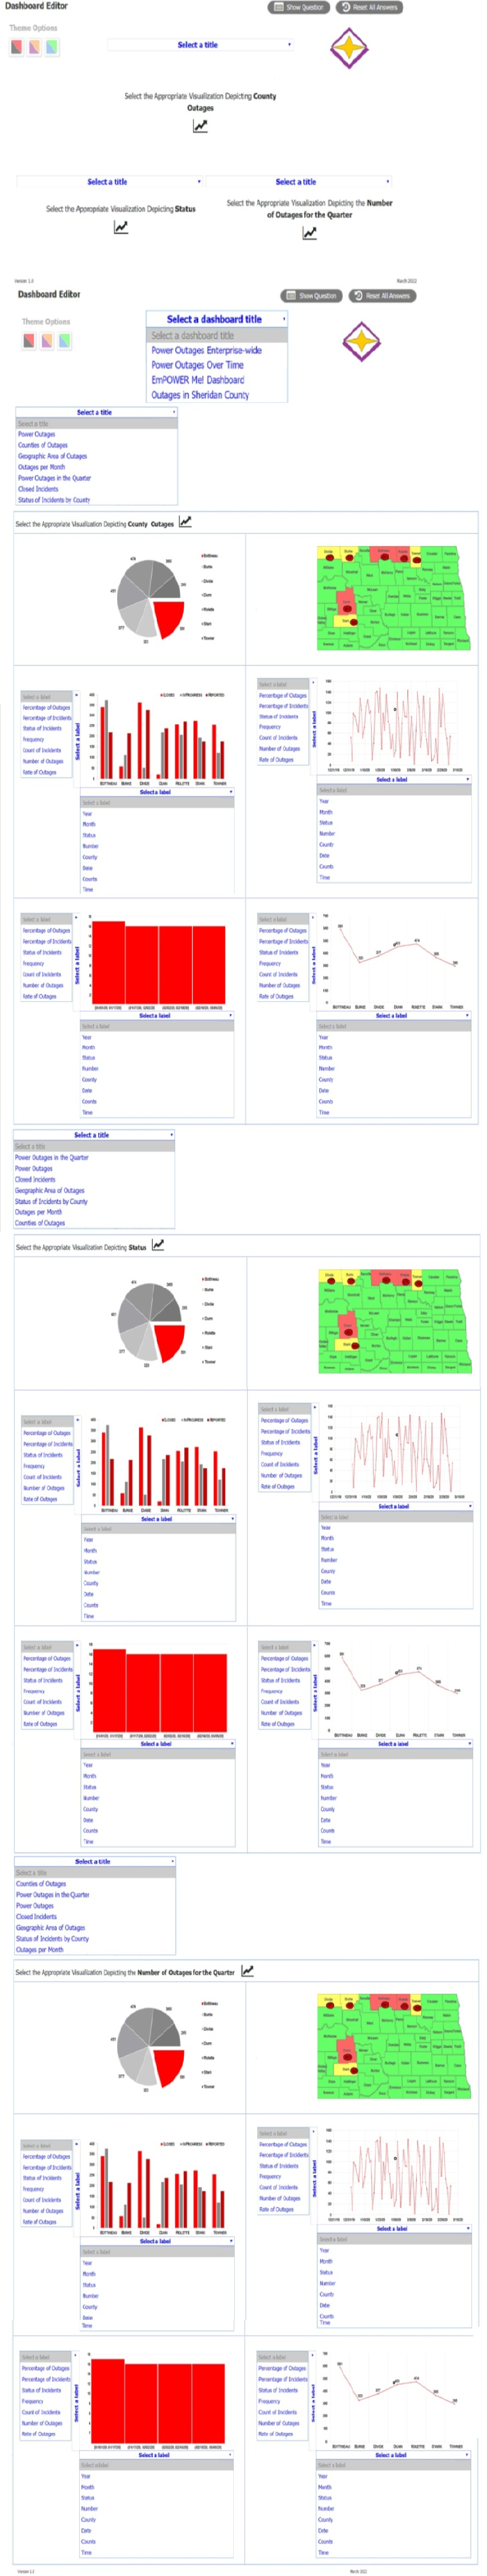
The director of operations at a power company needs data to help identify where company
resources should be allocated in order to monitor activity for outages and restoration of
power in the entire state. Specifically, the director wants to see the following:
* County outages
* Status
* Overall trend of outages
INSTRUCTIONS:
Please, select each visualization to fit the appropriate space on the dashboard and choose
an appropriate color scheme. Once you have selected all visualizations, please, select the
appropriate titles and labels, if applicable. Titles and labels may be used more than once.
If at any time you would like to bring back the initial state of the simulation, please click the
Reset All button.
What subset of Structured Query Language (SQL) is used to add, remove, modify, or retrieve the information stored within a relational database?
A. DDL.
B. DSL.
C. DQL.
D. DML.
Under which of the following circumstances should the null hypothesis be accepted when a = 0.05?
A. When p is 0.00003
B. When p is 0.001
C. When p is 0.04
D. When p is 0.06
A reporting analyst is creating a dashboard that shows the year-over-year performance for a sales organization. Which of the following is the best visual for the analyst use to illustrate the organization's performance?
A. Pie chart
B. Scatter plot
C. Heat map
D. Line chart
An analyst is working for an organization that has a vast amount of data stored across various systems and databases. Employees have difficulty locating and understanding the currently available data assets. Which of the following tools should the analyst implement to best solve this issue?
A. Data lake
B. Business glossary
C. Data catalog
D. Operational data store
The process of performing initial investigations on data to spot outliers, discover patterns, and test assumptions with statistical insight and graphical visualization is called:
A. a t-test.
B. a performance analysis.
C. an exploratory data analysis.
D. a link analysis.
Which of the following is concatenate typically used to combine?
A. Rows
B. Columns
C. Tables
D. Databases
Which of the following concepts should be applied if a data set with 40 fields needs to be pared down to 20 fields and contains similar data across multiple fields?
A. Duplication
B. Consolidation
C. Compliance
D. Standardization
| Page 11 out of 33 Pages |
| 6789101112131415 |
| DA0-001 Practice Test Home |
Real-World Scenario Mastery: Our DA0-001 practice exam don't just test definitions. They present you with the same complex, scenario-based problems you'll encounter on the actual exam.
Strategic Weakness Identification: Each practice session reveals exactly where you stand. Discover which domains need more attention, before CompTIA Data+ Certification Exam exam day arrives.
Confidence Through Familiarity: There's no substitute for knowing what to expect. When you've worked through our comprehensive DA0-001 practice exam questions pool covering all topics, the real exam feels like just another practice session.
Copyright © All Rights Reserved