How do you configure the Builder to display the table in the screenshot in a story report? Note: There are 3 correct answers to this question.
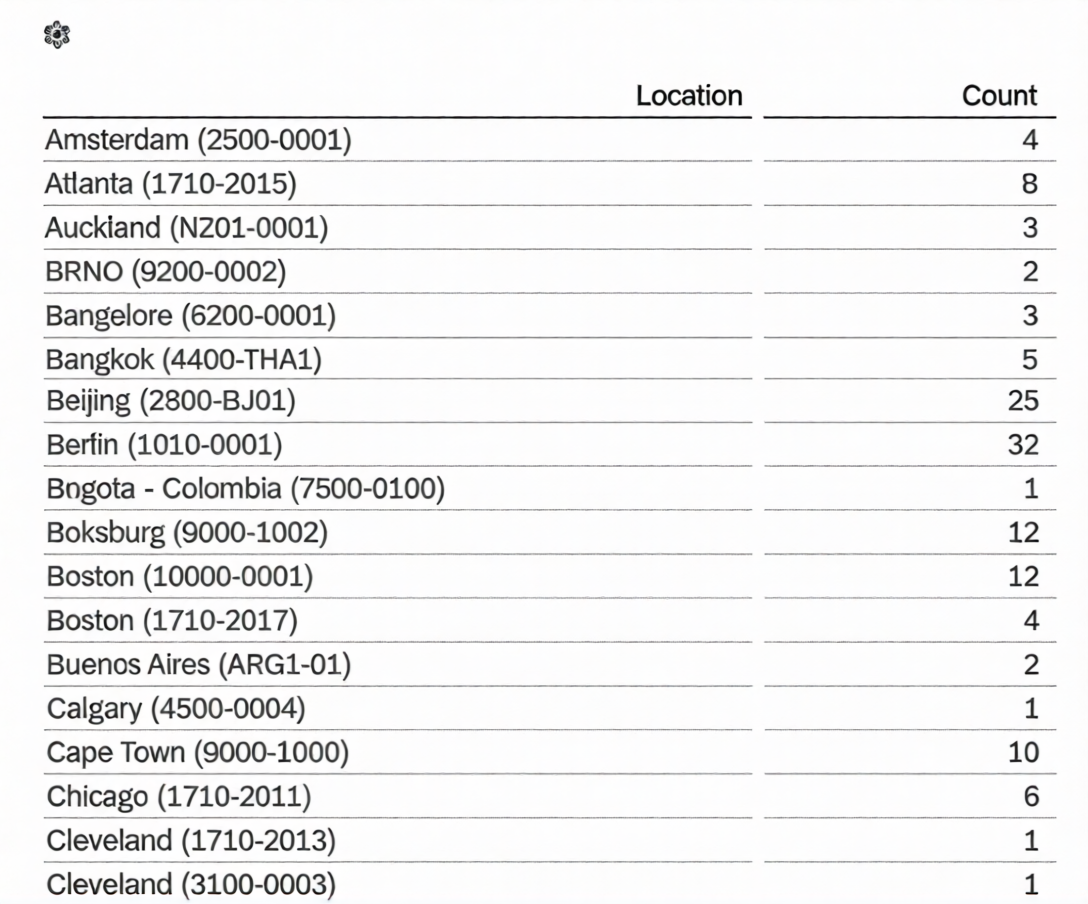
A. Row: Count
B. Column: Location
C. Table Structure: Aggregated List
D. Column: Count
E. Table Structure: Cross-tab
What features are available only when you use Business Intelligence and Reporting Tools (BIRT) with Table Reports? Note: There are 2 correct answers to this question.
A. SFTP scheduling
B. Simple data extraction
C. Printable chart with custom formatting requirements
D. Advanced cell level formulas
You want to create a tile-based dashboard and make it available to users. After you created and named the dashboard, which steps are required?
A. Create tiles(s). Select filters. Save dashboard.
B. Select tile(s). Select dataset. Save dashboard.
C. Create tile(s). Select dataset. Share dashboard.
D. Select tile(s). Save dashboard. Share dashboard.
You are using Report Center to share a canvas report. You share the report with a Dynamic Group (see
attached image). Who is the report shared with?
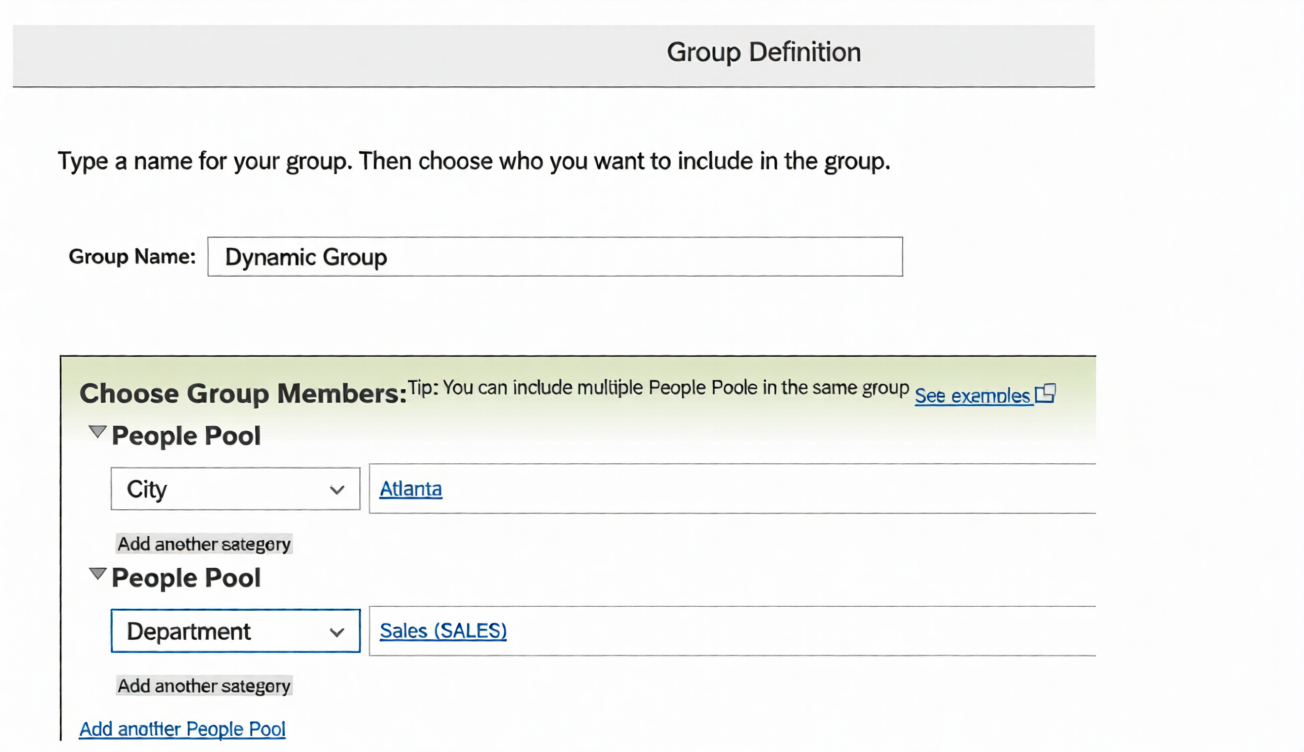
A. Employees of the Sales department
B. Employees of the Sales departments and all employees of Atlanta
C. Employees of the Sales department of Atlanta
D. Employees of Atlanta
A. PDFSam
B. Business Intelligence Reporting Tool (BIRT)
C. LMS Report Designer
D. YouCalc designer
A report consumer claims that a canvas report shared with them is NO longer available in Report Center. Upon your investigation, you find the report has been deleted. You need to reproduce the report as quickly as possible. What action do you take?
A. Use the Restore Deleted Report tool to restore the report.
B. Create a new report and add orphaned pages. Share the report.
C. Contact SAP SuccessFactors support to request the report be restored.
D. Use the Recycle Bin to restore the Report.
When you format a list report component, which actions can you perform? Note: There are 3 correct answers to this question.
A. Change the order of columns.
B. Change column types.
C. Adjust column widths.
D. Change column headers.
E. Save formats to a template.
When using Report Center, what permissions are required to create a canvas report on Employee Profile data using the Detailed Reporting tool? Note: There are 3 correct answers to this question.
A. Canvas Designer Admin
B. Canvas Designer
C. Create Reports: Employee Profile
D. Run Report: Employee Profile
E. Report Center
The data source used by the two tables only displays current (active) employees. How would you configure a filter on the table End of Previous Year Headcount by Location to display data accurately?
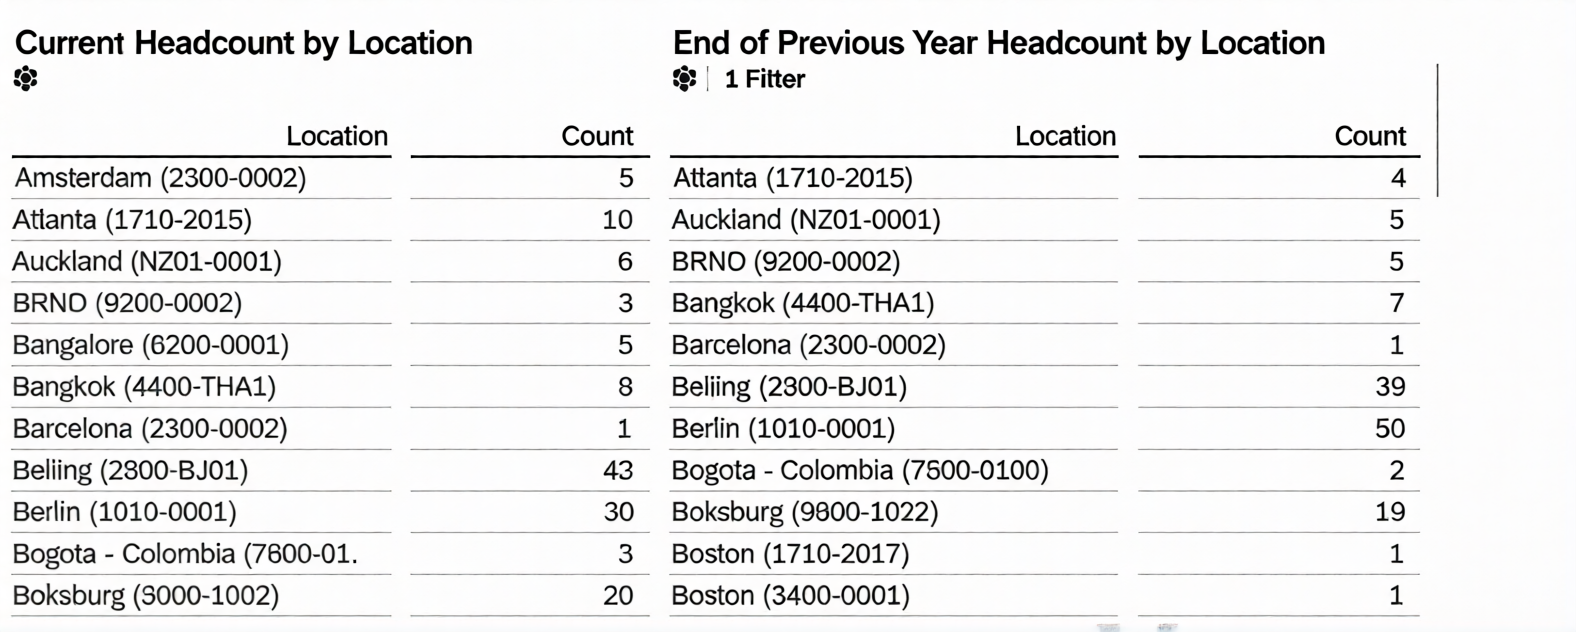
Note: There are 2 correct answers to this question.
A. Set the Range type to Standard.
B. Set a filter on Hire Date (Range).
C. Set a filter on Hire Date (Member).
D. Set the Range type to Offset.
You are creating a Story report on employment and compensation information. You have created two queries to support the story report. The table and the left chart are using an employment query as its data source. The right chart uses a compensation query as its data source. Both queries include the field for the employee Job Title. When you add an input control to the page, it only filters the table and the left chart. What action must you take to configure the input control to effect both charts and the table?
A. Convert it to a Story Filter.
B. Update Linked Analysis.
C. Enable Cascading Effects.
D. Set up Linked Dimensions.
You are constructing a Story. You want to return the quarter to date event records to count terminations. Which options would you set in the time filter? Note: There are 3 correct answers to this question.
A. Range Parameters: Period to Date
B. Range period: Actual start/end date of the current quarter
C. Range Type: dynamic
D. Range Type: fixed
E. Records Returned: Include only records that begin in your defined date range
In Detailed Reporting, what functionality can be used in a calculated column? Note; There are 2 correct answers to this question.
A. Concatenation
B. If/Then/Else statement
C. Average
D. Data type conversion
| Page 1 out of 7 Pages |