Which of the following items should be included in a handover to the end user to enable them to use and run a trained model on their own system? (Select three.)
A. Information on the folder structure in your local machine
B. Intermediate data files
C. Link to a GitHub repository of the codebase
D. README document
E. Sample input and output data files
Explanation: A handover is the process of transferring the ownership and responsibility of
an ML system from one party to another, such as from the developers to the end users. A
handover should include all the necessary information and resources that enable the end
users to use and run a trained model on their own system. Some of the items that should
be included in a handover are:
Which of the following are true about the transform-design pattern for a machine learning
pipeline? (Select three.)
It aims to separate inputs from features
A. It encapsulates the processing steps of ML pipelines.
B. It ensures reproducibility.
C. It represents steps in the pipeline with a directed acyclic graph (DAG).
D. It seeks to isolate individual steps of ML pipelines.
E. It transforms the output data after production.
Explanation: The transform-design pattern for ML pipelines aims to separate inputs from features, encapsulate the processing steps of ML pipelines, and represent steps in the pipeline with a DAG. These goals help to make the pipeline modular, reusable, and easy to understand. The transform-design pattern does not seek to isolate individual steps of ML pipelines, as this would create entanglement and dependency issues. It also does not transform the output data after production, as this would violate the principle of separation of concerns.
Which of the following is a common negative side effect of not using regularization?
A. Overfitting
B. Slow convergence time
C. Higher compute resources
D. Low test accuracy
Explanation: Overfitting is a common negative side effect of not using regularization. Regularization is a technique that reduces the complexity of a model by adding a penalty term to the loss function, which prevents the model from learning too many parameters that may fit the noise in the training data. Overfitting occurs when the model performs well on the training data but poorly on the test data or new data, because it has memorized the training data and cannot generalize well.
Which two of the following decrease technical debt in ML systems? (Select two.)
A. Boundary erosion
B. Design anti-patterns
C. Documentation readability
D. Model complexity
E. Refactoring
Explanation: Technical debt is a metaphor that describes the implied cost of additional
work or rework caused by choosing an easy or quick solution over a better but more
complex solution. Technical debt can accumulate in ML systems due to various factors,
such as changing requirements, outdated code, poor documentation, or lack of testing.
Some of the ways to decrease technical debt in ML systems are:
Given a feature set with rows that contain missing continuous values, and assuming the data is normally distributed, what is the best way to fill in these missing features?
A. Delete entire rows that contain any missing features.
B. Fill in missing features with random values for that feature in the training set.
C. Fill in missing features with the average of observed values for that feature in the entire dataset.
D. Delete entire columns that contain any missing features.
Explanation: Missing values are a common problem in data analysis and machine learning, as they can affect the quality and reliability of the data and the model. There are various methods to deal with missing values, such as deleting, imputing, or ignoring them. One of the most common methods is imputing, which means replacing the missing values with some estimated values based on some criteria. For continuous variables, one of the simplest and most widely used imputation methods is to fill in the missing values with the mean (average) of the observed values for that variable in the entire dataset. This method can preserve the overall distribution and variance of the data, as well as avoid introducing bias or noise.
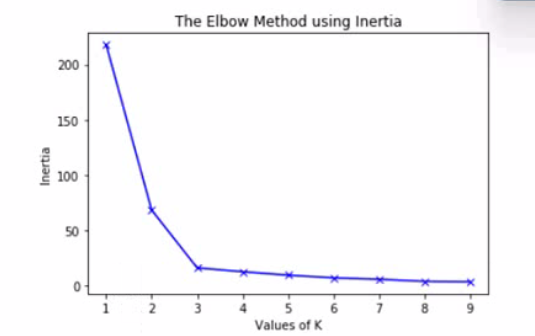
The graph is an elbow plot showing the inertia or within-cluster sum of squares on the yaxis
and number of clusters (also called K) on the x-axis, denoting the change in inertia as
the clusters change using k-means algorithm.
What would be an optimal value of K to ensure a good number of clusters?
A. 2
B. 3
C. 5
D. 9
Explanation: The optimal value of K is the one that minimizes the inertia or within-cluster sum of squares, while avoiding too many clusters that may overfit the data. The elbow plot shows a sharp decrease in inertia from K = 1 to K = 2, and then a more gradual decrease from K = 2 to K = 3. After K = 3, the inertia does not change much as K increases. Therefore, the elbow point is at K = 3, which is the optimal value of K for this data.
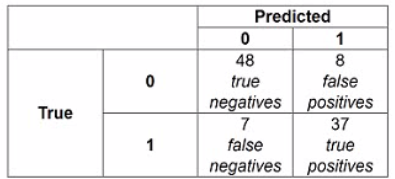
The following confusion matrix is produced when a classifier is used to predict labels on a test dataset. How precise is the classifier?
A. 48/(48+37)
B. 37/(37+8)
C. 37/(37+7)
D. (48+37)/100
Explanation: Precision is a measure of how well a classifier can avoid false positives (incorrectly predicted positive cases). Precision is calculated by dividing the number of true positives (correctly predicted positive cases) by the number of predicted positive cases (true positives and false positives). In this confusion matrix, the true positives are 37 and the false positives are 8, so the precision is 37/(37+8) = 0.822.
When should you use semi-supervised learning? (Select two.)
A. A small set of labeled data is available but not representative of the entire distribution.
B. A small set of labeled data is biased toward one class.
C. Labeling data is challenging and expensive.
D. There is a large amount of labeled data to be used for predictions.
E. There is a large amount of unlabeled data to be used for predictions.
Explanation: Semi-supervised learning is a type of machine learning that uses both
labeled and unlabeled data to train a model. Semi-supervised learning can be useful when:
A change in the relationship between the target variable and input features is
A. concept drift.
B. covariate shift.
C. data drift.
D. model decay.
Explanation: Concept drift, also known as model drift, occurs when the task that the model was designed to perform changes over time. For example, imagine that a machine learning model was trained to detect spam emails based on the content of the email. If the types of spam emails that people receive change significantly, the model may no longer be able to accurately detect spam.
You have a dataset with thousands of features, all of which are categorical. Using these features as predictors, you are tasked with creating a prediction model to accurately predict the value of a continuous dependent variable. Which of the following would be appropriate algorithms to use? (Select two.)
A. K-means
B. K-nearest neighbors
C. Lasso regression
D. Logistic regression
E. Ridge regression
Explanation: Lasso regression and ridge regression are both types of linear regression models that can handle high-dimensional and categorical data. They use regularization techniques to reduce the complexity of the model and avoid overfitting. Lasso regression uses L1 regularization, which adds a penalty term proportional to the absolute value of the coefficients to the loss function. This can shrink some coefficients to zero and perform feature selection. Ridge regression uses L2 regularization, which adds a penalty term proportional to the square of the coefficients to the loss function. This can shrink all coefficients towards zero and reduce multicollinearity.
Which of the following algorithms is an example of unsupervised learning?
A. Neural networks
B. Principal components analysis
C. Random forest
D. Ridge regression
Explanation: Unsupervised learning is a type of machine learning that involves finding
patterns or structures in unlabeled data without any predefined outcome or feedback.
Unsupervised learning can be used for various tasks, such as clustering, dimensionality
reduction, anomaly detection, or association rule mining. Some of the common algorithms
for unsupervised learning are:
A market research team has ratings from patients who have a chronic disease, on several functional, physical, emotional, and professional needs that stay unmet with the current therapy. The dataset also captures ratings on how the disease affects their day-to-day activities. A pharmaceutical company is introducing a new therapy to cure the disease and would like to design their marketing campaign such that different groups of patients are targeted with different ads. These groups should ideally consist of patients with similar unmet needs. Which of the following algorithms should the market research team use to obtain these groups of patients?
A. k-means clustering
B. k-nearest neighbors
C. Logistic regression
D. Naive-Bayes
Explanation: k-means clustering is an algorithm that should be used by the market research team to obtain groups of patients with similar unmet needs. k-means clustering is an unsupervised learning technique that partitions the data into k clusters based on the similarity of the features. The algorithm iteratively assigns each data point to the cluster with the nearest centroid and updates the centroid until convergence. k-means clustering can help identify patterns and segments in the data that may not be obvious or intuitive.
| Page 2 out of 8 Pages |
| Previous |